. 2016 May;9(3):647-58.
doi: 10.1038/mi.2015.88. Epub 2015 Sep 16.

Assessing DNA methylation in the developing human intestinal epithelium: potential link to inflammatory bowel disease

Affiliations

Assessing DNA methylation in the developing human intestinal epithelium: potential link to inflammatory bowel disease

J Kraiczy et al. Mucosal Immunol. 2016 May.

Abstract

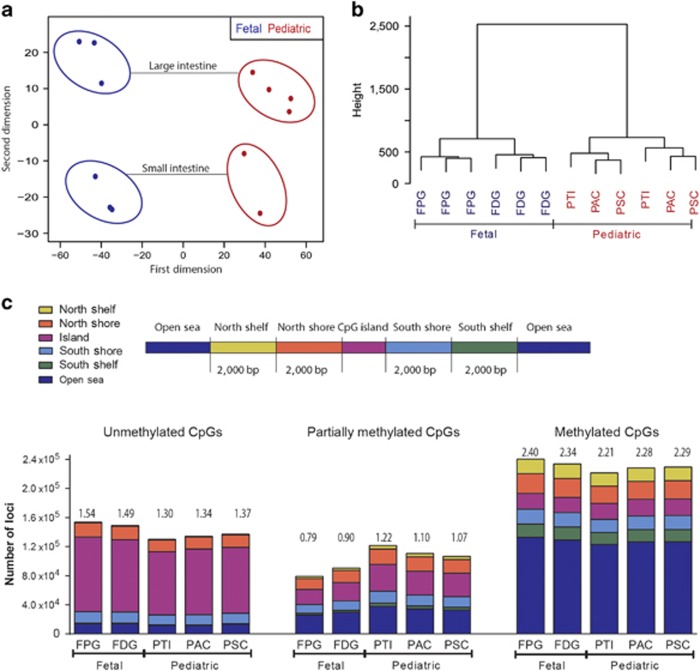
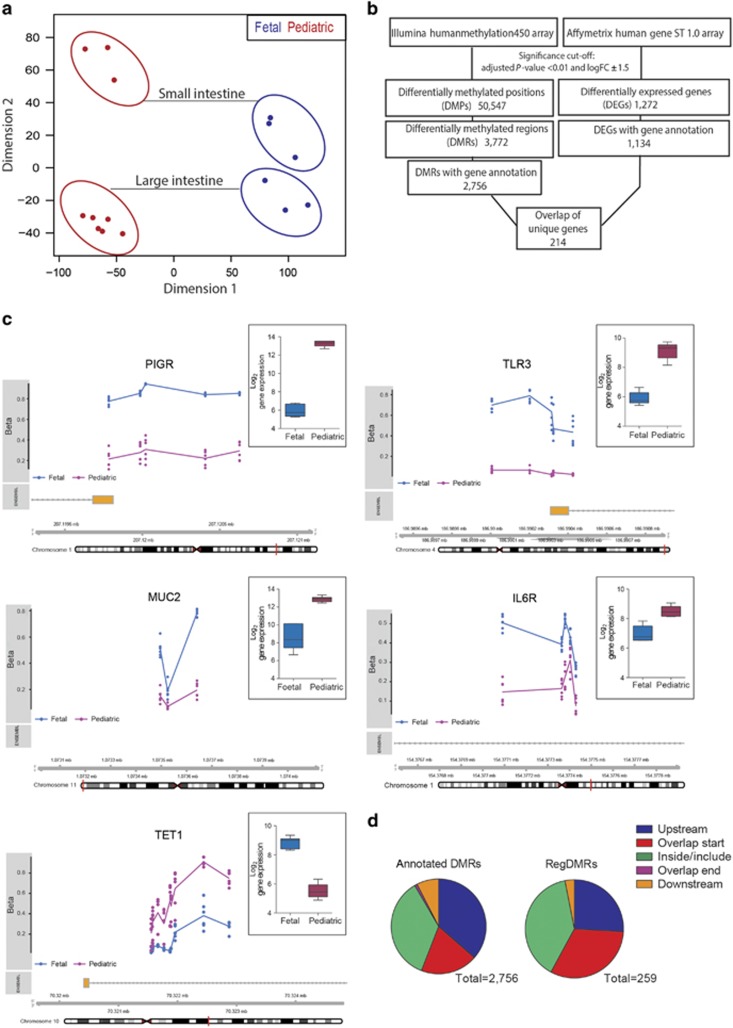
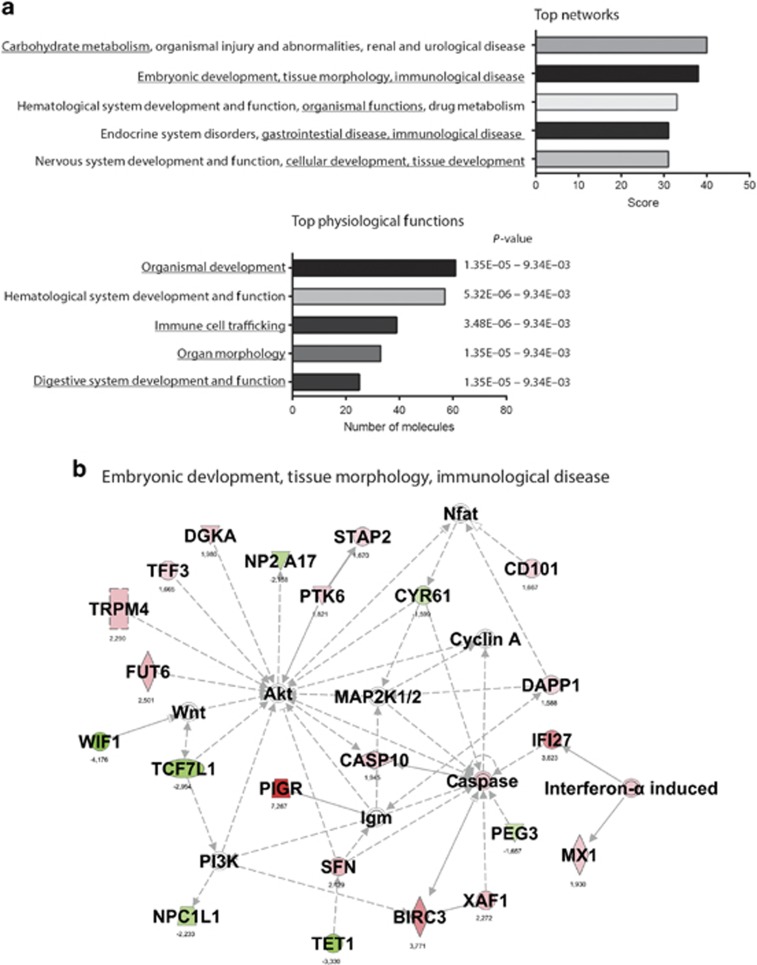
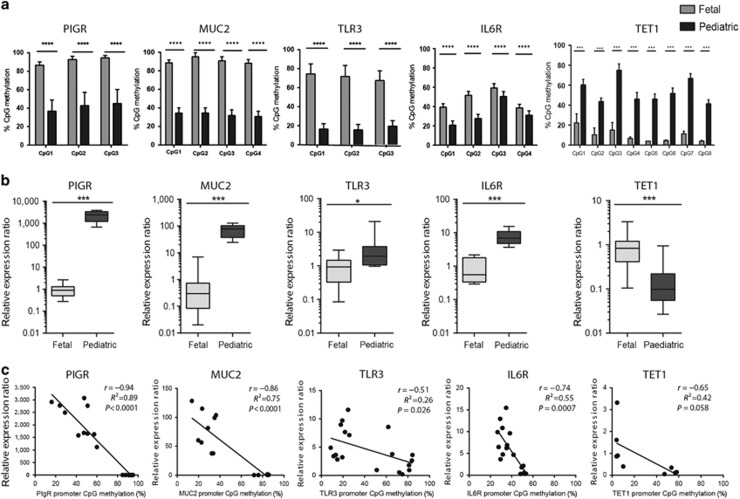
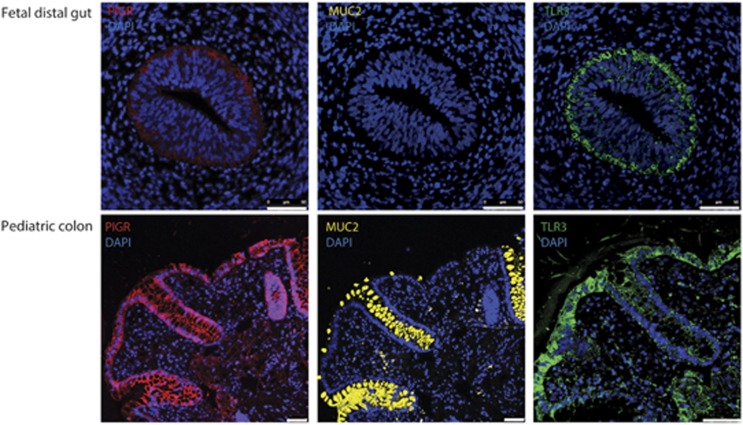
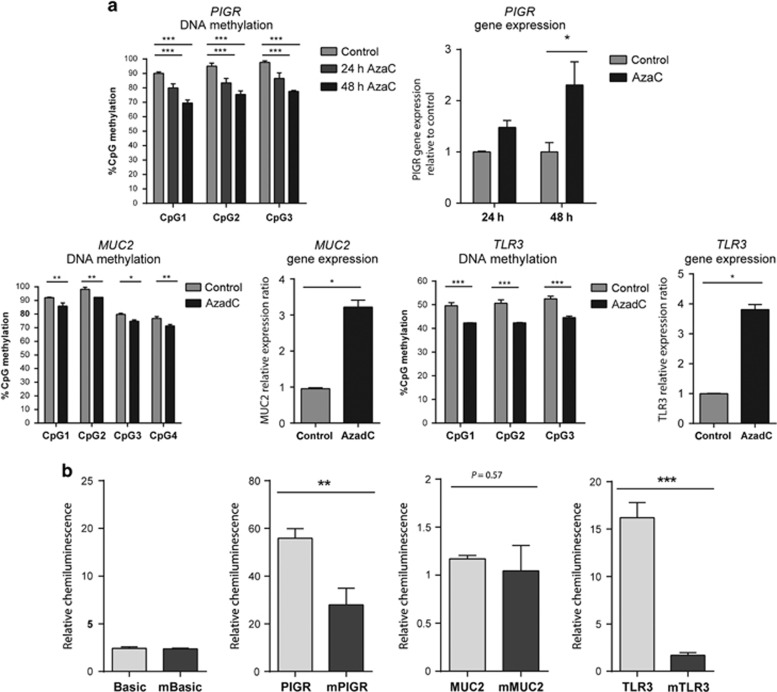
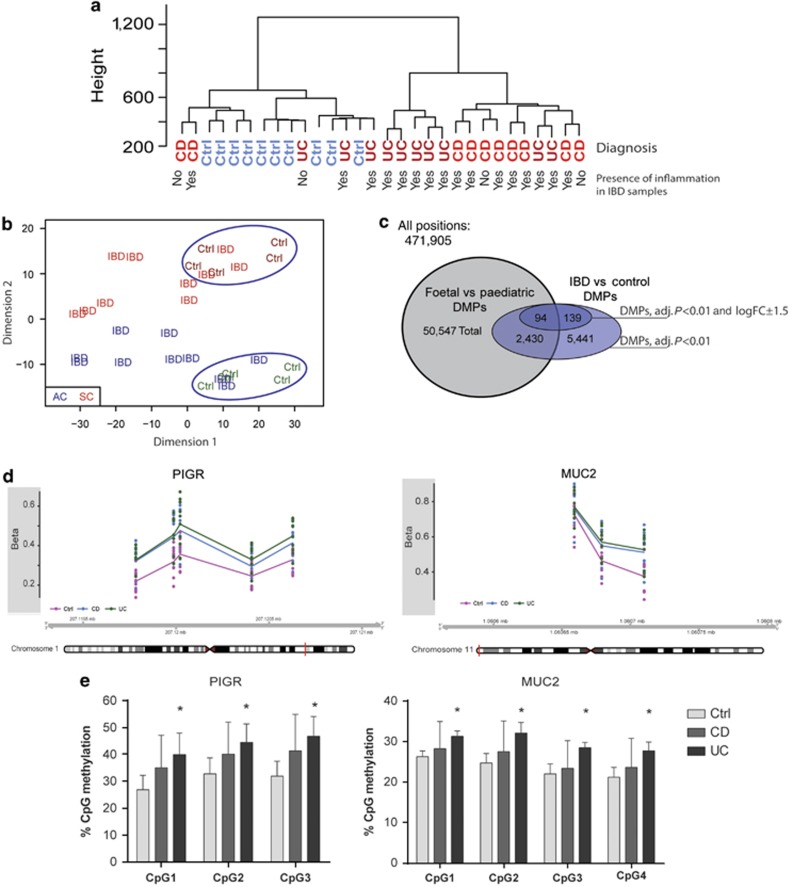
DNA methylation is one of the major epigenetic mechanisms implicated in regulating cellular development and cell-type-specific gene expression. Here we performed simultaneous genome-wide DNA methylation and gene expression analysis on purified intestinal epithelial cells derived from human fetal gut, healthy pediatric biopsies, and children newly diagnosed with inflammatory bowel disease (IBD). Results were validated using pyrosequencing, real-time PCR, and immunostaining. The functional impact of DNA methylation changes on gene expression was assessed by employing in-vitro assays in intestinal cell lines. DNA methylation analyses allowed identification of 214 genes for which expression is regulated via DNA methylation, i.e. regulatory differentially methylated regions (rDMRs). Pathway and functional analysis of rDMRs suggested a critical role for DNA methylation in regulating gene expression and functional development of the human intestinal epithelium. Moreover, analysis performed on intestinal epithelium of children newly diagnosed with IBD revealed alterations in DNA methylation within genomic loci, which were found to overlap significantly with those undergoing methylation changes during intestinal development. Our study provides novel insights into the physiological role of DNA methylation in regulating functional maturation of the human intestinal epithelium. Moreover, we provide data linking developmentally acquired alterations in the DNA methylation profile to changes seen in pediatric IBD.


Figures

Figure 1
Figure 1
Genome-wide DNA methylation profiles of purified human fetal (n=6 from 3 donors) and pediatric intestinal epithelium (n=6 from 2 donors). (a) Multidimensional scaling analysis (MDS) plot displaying the overall DNA methylation profiles considering all probes. The first dimension (x axis) separates fetal from pediatric epithelial samples. The second dimension distinguishes epithelium according to gut location, separating proximal, small bowel from distal, large bowel. (b) Unsupervised hierarchical clustering confirms developmental age as the main factor separating samples into two groups, i.e., fetal and pediatric. (c) Distribution of loci according to their methylation status; “unmethylated,” “partially methylated,” and “fully methylated”. The average number of loci in each group is plotted. Each bar is further sub-divided, indicating location of probes in relation to CpG islands. FDG, fetal distal gut (n=3); FPG, fetal proximal gut (n=3); PAC, pediatric ascending colon (n=2) ; PSC, pediatric sigmoid colon (n=2); PTI, pediatric terminal ileum (n=2).
Figure 2
Figure 2
'Genome-wide gene expression analysis was performed on simultaneously extracted RNA from purified human intestinal epithelium. (a) Multidimensional scaling analysis (MDS) plot displaying clustering of samples according to developmental age in the first dimension, whereas the second dimension separates epithelial cells according to gut segment. (b) Overview of the algorithm used to identify regulatory differentially methylated regions (rDMRs) by integrating both genome-wide DNA and gene expression data. In total, we identified 259 rDMRs associated with 214 genes. (c) Summary plots of selected rDMRs displaying DNA methylation and gene expression of PIGR (polymeric immunoglobulin receptor), TLR3, TET1 (tet methylcytosine dioxygenase 1), MUC2, and IL6R. The top panel indicates the level of DNA methylation across the DMR according to the methylation β-value (y axis). Each point represents one sample and the line indicating the average methylation value. Additional panels indicate relation of DMR to the reference human genome. Inset displays corresponding gene expression plotted as log2 average expression of each sample. (d) Distribution of all DMRs (i.e., including DMRs for which associated genes do not display expression changes) vs. rDMRs according to their genomic location. rDMRs are found more frequently to be located either fully inside or overlapping with transcription start site (TSS). DMP, differentially methylated position; FDG, fetal distal gut (n=3); FPG, fetal proximal gut (n=3); PAC, pediatric ascending colon (n=3); PSC, pediatric sigmoid colon (n=3); PTI, pediatric terminal ileum (n=3).
Figure 3
Figure 3
Ingenuity pathway analysis (IPA) performed on identified regulatory differentially methylated region (rDMR)-containing genes. (a) Bar plot displaying scores of the top five networks and physiological functions, indicating the number of involved genes in each group and the enrichment P-value. (b) Major network “Embryonic development, tissue morphology, immunological disease”. Graph shows gene symbols with color coding of differentially methylated and expressed genes. Red color indicates gene expression upregulated, green color represents gene expression downregulated in pediatric epithelium (compared with fetal). Numbers below symbols indicate the expression logFC (pediatric vs. fetal). Non-colored symbols indicate genes not in the input data but involved in the network shown. Molecule relationships were simplified using the “IPA Path Designer” tool.
Figure 4
Figure 4
Validation of DNA methylation and gene expression differences between fetal and pediatric epithelial cells in a second sample cohort using pyrosequencing and reverse transcription–PCR. (a) CpG methylation in promoter regions of PIGR (polymeric immunoglobulin receptor), MUC2, TLR3, IL6R, and TET1 (tet methylcytosine dioxygenase 1). Data are presented as the average and s.d. of absolute DNA methylation values in %. Two-way analysis of variance, *P<0.05, ***P<0.005, ****P<0.001, n=6–16 (minimum of four donors in each group). (b) Gene expression was assessed in parallel displaying significant differences between fetal and pediatric epithelial samples. Mann–Whitney test, *P<0.05, *** P<0.005, n=7–12. (c) Correlation between DNA methylation across the assessed region (average of three to eight CpGs) and respective mRNA expression was assessed by calculating the Pearson's correlation coefficient (r). Each dot represents one sample.
Figure 5
Figure 5
Protein expression of polymeric immunoglobulin receptor (PIGR), MUC2, and TLR3 was assessed by immunofluorescent staining in fetal distal gut (upper panel) and pediatric ascending colon (lower panel). Expression of all three proteins was found to be either absent or low in fetal gut samples and highly abundant in pediatric colonic epithelium. Fetal gut sections display the presence of a stratified epithelial layer with a complete lack of crypt villus axis. Protein expression pattern corresponds with mRNA levels of the respective genes and is confined to the intestinal epithelium. Staining was performed on tissue samples obtained from three donors in each group, representative images are shown. White bar represents 50 μm. Blue, 4',6-diamidino-2-phenylindole-counterstained nuclei; red, PIgR; yellow, Muc2; green, Tlr3.
Figure 6
Figure 6
In-vitro assays demonstrate the direct impact of DNA methylation on transcription of regulatory differentially methylated region (rDMR)-containing genes. (a) Caco-2 cells were treated with DNA methyltransferase (DNMT) inhibitor (10 μM 5-Azacytidine (AzaC) for 24 h and for 48 h or 5 mM 5-Azadeoxycytidine (AzadC) for 24 h. DNA methylation of the polymeric immunoglobulin receptor (PIGR), MUC2, and TLR3 promoter was assessed by pyrosequencing. Reduced levels of CpG methylation with a corresponding increase in mRNA expression was observed. Data are displayed as mean+s.d. of three independent experiments performed in duplicates. Two-way analysis of variance, post test; Sidak, *P<0.05, **P<0.005, ***P<0.001 vs. dimethylsulfoxide (DMSO) vehicle control. (b) Promoter regions of MUC2, TLR3, and PIGR were cloned into a CpG-free luciferase reporter plasmid. In-vitro methylation of TLR3 and PIGR promoter plasmids led to a significant reduction in luciferase signal compared with mock-treated unmethylated plasmids. Basic luciferase activity of MUC2 promoter containing plasmid was found to be low in Caco-2 cells and no further reduction was observed following in-vitro methylation. Basic, CpG-free plasmid with no promoter. Renilla-luciferase served as control to correct for transfection efficiency. Mean+s.d. of three independent experiments performed in duplicates; Student's unpaired t-test, two tailed, n=3 per condition. ***P<0.0001, **P<0.005, P<0.57 (NS, not significant).
Figure 7
Figure 7
Alteration of DNA methylation in colonic epithelial cells of children diagnosed with inflammatory bowel disease (IBD) occurs at sites undergoing dynamic methylation changes during gastrointestinal (GI) development. (a) Hierarchical clustering of genome-wide DNA methylation profiles of colonic intestinal epithelial cells obtained from children newly diagnosed with IBD (treatment naive) and matched healthy controls (n=5 patients per group and 2 biopsy samples per patient). The presence of mucosal inflammation is indicated. (b) Multidimensional scaling analysis (MDS) analysis confirms methylation differences present in the majority of IBD samples compared with healthy controls. (c) Venn diagram showing the overlap of significant differentially methylated positions (DMPs) derived from the comparison of fetal vs. pediatric samples in the discovery cohort and newly diagnosed IBD epithelium vs. healthy controls. Up to 40% of CpGs displaying significant alterations in IBD epithelium were also found to undergo significant DNA methylation changes during the transition from fetal to pediatric epithelium. Overlaps between DMPs were found to be highly significant (hypergeometric enrichment test P<8.5 × E−32). (d) Alterations of DNA methylation in the intestinal epithelium of children newly diagnosed with IBD were found to be present in regulatory differentially methylated regions (rDMRs) of MUC2 and polymeric immunoglobulin receptor (PIGR). Methylation β-values derived from array data (IBD sample cohort) are plotted in genomic context. (e) DNA methylation of respective DMRs assessed using pyrosequencing. Mean+s.d., n=5 individuals per group (i.e., 5 healthy controls, 5 CD, and 5 UC). Analyses were performed in duplicates on two biopsy samples per patient, multiple t-test, post test: Holm–Sidak, *P<0.05 vs. control. CD, Crohn's Disease; Ctrl, Control; UC, ulcerative colitits.

References

    1. Peterson, L.W. & Artis, D. Intestinal epithelial cells: regulators of barrier function and immune homeostasis. Nat. Rev. Immunol. 14, 141–153 (2014). - PubMed
    1. Noah, T.K., Donahue, B. & Shroyer, N.F. Intestinal development and differentiation. Exp. Cell Res. 317, 2702–2710 (2011). - PMC - PubMed
    1. de Santa Barbara, P., van den Brink, G.R. & Roberts, D.J. Development and differentiation of the intestinal epithelium. Cell. Mol. Life Sci. 60, 1322–1332 (2003). - PMC - PubMed
    1. Renz, H., Brandtzaeg, P. & Hornef, M. The impact of perinatal immune development on mucosal homeostasis and chronic inflammation. Nat. Rev. Immunol. 12, 9–23 (2012). - PubMed
    1. Dupaul-Chicoine, J., Dagenais, M. & Saleh, M. Crosstalk between the intestinal microbiota and the innate immune system in intestinal homeostasis and inflammatory bowel disease. Inflamm. Bowel Dis. 19, 2227–2237 (2013). - PubMed

Publication types

LinkOut - more resources