A Multiscale Vibrational Spectroscopic Approach for Identification and Biochemical Characterization of Pollen
- PMID: 26376486
- PMCID: PMC4574200
- DOI: 10.1371/journal.pone.0137899
A Multiscale Vibrational Spectroscopic Approach for Identification and Biochemical Characterization of Pollen
Abstract
Background: Analysis of pollen grains reveals valuable information on biology, ecology, forensics, climate change, insect migration, food sources and aeroallergens. Vibrational (infrared and Raman) spectroscopies offer chemical characterization of pollen via identifiable spectral features without any sample pretreatment. We have compared the level of chemical information that can be obtained by different multiscale vibrational spectroscopic techniques.
Methodology: Pollen from 15 different species of Pinales (conifers) were measured by seven infrared and Raman methodologies. In order to obtain infrared spectra, both reflectance and transmission measurements were performed on ground and intact pollen grains (bulk measurements), in addition, infrared spectra were obtained by microspectroscopy of multigrain and single pollen grain measurements. For Raman microspectroscopy measurements, spectra were obtained from the same pollen grains by focusing two different substructures of pollen grain. The spectral data from the seven methodologies were integrated into one data model by the Consensus Principal Component Analysis, in order to obtain the relations between the molecular signatures traced by different techniques.
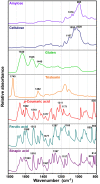
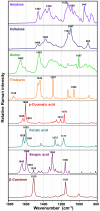
Results: The vibrational spectroscopy enabled biochemical characterization of pollen and detection of phylogenetic variation. The spectral differences were clearly connected to specific chemical constituents, such as lipids, carbohydrates, carotenoids and sporopollenins. The extensive differences between pollen of Cedrus and the rest of Pinaceae family were unambiguously connected with molecular composition of sporopollenins in pollen grain wall, while pollen of Picea has apparently higher concentration of carotenoids than the rest of the family. It is shown that vibrational methodologies have great potential for systematic collection of data on ecosystems and that the obtained phylogenetic variation can be well explained by the biochemical composition of pollen. Out of the seven tested methodologies, the best taxonomical differentiation of pollen was obtained by infrared measurements on bulk samples, as well as by Raman microspectroscopy measurements of the corpus region of the pollen grain. Raman microspectroscopy measurements indicate that measurement area, as well as the depth of focus, can have crucial influence on the obtained data.
Conflict of interest statement
Figures


Similar articles
-
Chemical characterization and identification of Pinaceae pollen by infrared microspectroscopy.Planta. 2018 Jan;247(1):171-180. doi: 10.1007/s00425-017-2774-9. Epub 2017 Sep 14. Planta. 2018. PMID: 28913637
-
Vibrational microspectroscopy enables chemical characterization of single pollen grains as well as comparative analysis of plant species based on pollen ultrastructure.Planta. 2015 Nov;242(5):1237-50. doi: 10.1007/s00425-015-2380-7. Epub 2015 Aug 20. Planta. 2015. PMID: 26289829
-
Characterization of pollen by vibrational spectroscopy.Appl Spectrosc. 2010 Dec;64(12):1364-73. doi: 10.1366/000370210793561664. Appl Spectrosc. 2010. PMID: 21144154
-
Vibrational spectroscopic methods for cytology and cellular research.Analyst. 2014 Sep 21;139(18):4411-44. doi: 10.1039/c4an00636d. Analyst. 2014. PMID: 25028699 Review.
-
Vibrational spectroscopic studies of newly developed synthetic biopolymers.Biopolymers. 2010 May;93(5):403-17. doi: 10.1002/bip.21382. Biopolymers. 2010. PMID: 20091671 Review.
Cited by
-
Quantum Chemical Investigation into the Structural Analysis and Calculated Raman Spectra of Amylose Modeled with Linked Glucose Molecules.Molecules. 2024 Jun 14;29(12):2842. doi: 10.3390/molecules29122842. Molecules. 2024. PMID: 38930907 Free PMC article.
-
Mixture Analyses of Air-sampled Pollen Extracts Can Accurately Differentiate Pollen Taxa.Atmos Environ (1994). 2020 Dec 15;243:117746. doi: 10.1016/j.atmosenv.2020.117746. Epub 2020 Jul 6. Atmos Environ (1994). 2020. PMID: 32922147 Free PMC article.
-
Patterns of Phenolic Compounds in Betula and Pinus Pollen.Plants (Basel). 2023 Jan 12;12(2):356. doi: 10.3390/plants12020356. Plants (Basel). 2023. PMID: 36679068 Free PMC article.
-
Chemical characterization and identification of Pinaceae pollen by infrared microspectroscopy.Planta. 2018 Jan;247(1):171-180. doi: 10.1007/s00425-017-2774-9. Epub 2017 Sep 14. Planta. 2018. PMID: 28913637
-
A novel approach to study the morphology and chemistry of pollen in a phylogenetic context, applied to the halophytic taxon Nitraria L.(Nitrariaceae).PeerJ. 2018 Jul 19;6:e5055. doi: 10.7717/peerj.5055. eCollection 2018. PeerJ. 2018. PMID: 30038851 Free PMC article.
References
-
- Benton MJH, D. A.T. Introduction to Paleobiology and the Fossil Record. United Kingdom: Wiley-Blackwell; 2009. 592 p.
-
- Gottardini E, Rossi S, Cristofolini F, Benedetti L. Use of Fourier transform infrared (FT-IR) spectroscopy as a tool for pollen identification. Aerobiologia. 2007;23(3):211–9. 10.1007/s10453-007-9065-z - DOI
-
- Pappas CS, Tarantilis PA, Harizanis PC, Polissiou MG. New method for pollen identification by FT-IR spectroscopy. Appl Spectrosc. 2003;57(1):23–7. WOS:000180902000005. - PubMed
Publication types
MeSH terms
Substances
LinkOut - more resources
Full Text Sources
Other Literature Sources

