. 2015 Sep 16;16(1):702.
doi: 10.1186/s12864-015-1902-9.

A survey of tandem repeat instabilities and associated gene expression changes in 35 colorectal cancers

Affiliations

A survey of tandem repeat instabilities and associated gene expression changes in 35 colorectal cancers

Tugce Bilgin Sonay et al. BMC Genomics. .

Abstract

Background: Colorectal cancer is a major contributor to cancer morbidity and mortality. Tandem repeat instability and its effect on cancer phenotypes remain so far poorly studied on a genome-wide scale.

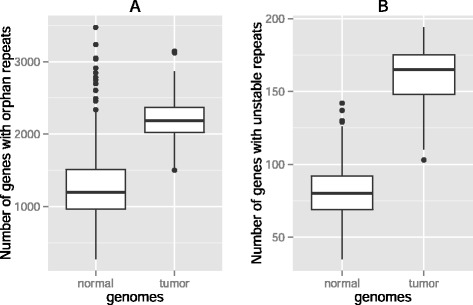
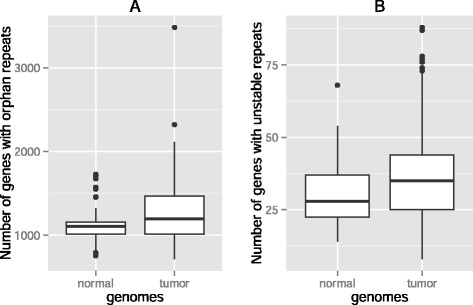
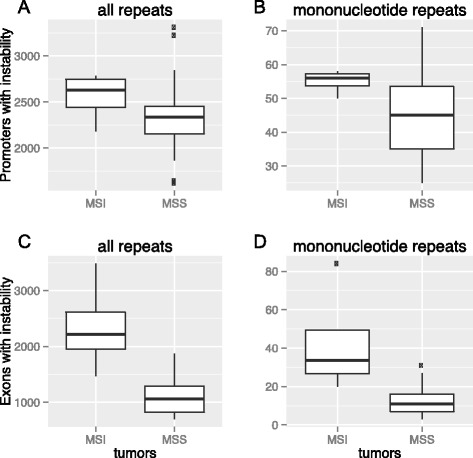
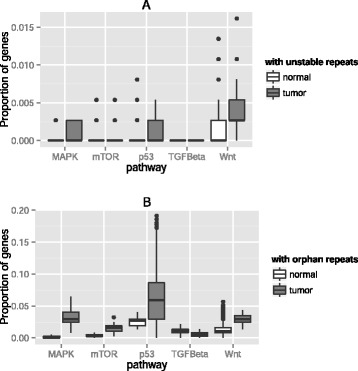
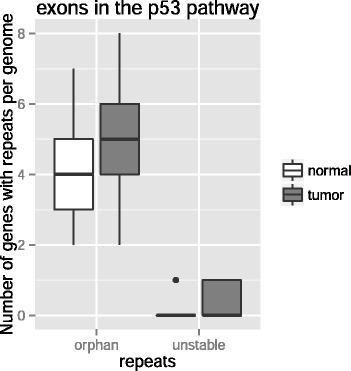
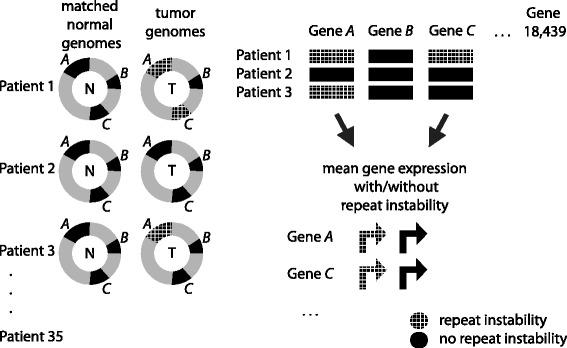
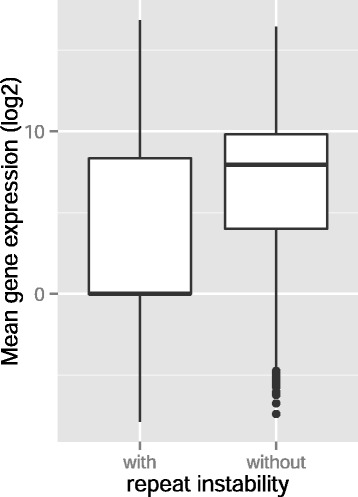
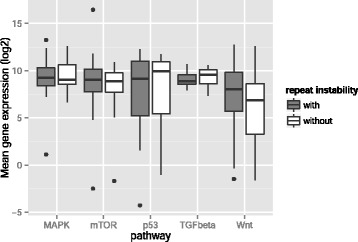
Results: Here we analyze the genomes of 35 colorectal tumors and their matched normal (healthy) tissues for two types of tandem repeat instability, de-novo repeat gain or loss and repeat copy number variation. Specifically, we study for the first time genome-wide repeat instability in the promoters and exons of 18,439 genes, and examine the association of repeat instability with genome-scale gene expression levels. We find that tumors with a microsatellite instable (MSI) phenotype are enriched in genes with repeat instability, and that tumor genomes have significantly more genes with repeat instability compared to healthy tissues. Genes in tumor genomes with repeat instability in their promoters are significantly less expressed and show slightly higher levels of methylation. Genes in well-studied cancer-associated signaling pathways also contain significantly more unstable repeats in tumor genomes. Genes with such unstable repeats in the tumor-suppressor p53 pathway have lower expression levels, whereas genes with repeat instability in the MAPK and Wnt signaling pathways are expressed at higher levels, consistent with the oncogenic role they play in cancer.

Conclusions: Our results suggest that repeat instability in gene promoters and associated differential gene expression may play an important role in colorectal tumors, which is a first step towards the development of more effective molecular diagnostic approaches centered on repeat instability.


Figures

Fig. 1
Fig. 1
Significantly more promoters with orphan and unstable repeats in tumors. Box plots of the number of gene promoters a) with orphan repeats b) with unstable repeats in normal-normal genome pairs (left boxes, n = 595) and in tumor-matched normal genome pairs (right boxes, n = 35) in promoter sequences. Thick horizontal lines in each box mark the median, edges of boxes correspond to the 25th and 75th percentiles, and whiskers cover 99.3 % of the data’s range. The repeat incidences in each pair of boxes are significantly different from each other within each panel (WRS Test, P < 10−16, P < 10−24, in panels a and b)
Fig. 2
Fig. 2
Significantly more genes with orphan and unstable repeats in tumors. Box plots of the number of genes a) with orphan repeats b) with unstable repeats in normal-normal genome pairs (left boxes, n = 595) and in tumor-matched normal genome pairs (right boxes, n = 35) in exons. Thick horizontal lines in each box mark the median, edges of boxes correspond to the 25th and 75th percentiles, and whiskers cover 99.3 % of the data’s range. The repeat incidences in each pair of boxes are significantly different from each other within each panel (WRS Test, P = 0.01, P = 0.04, in panels a and b)
Fig. 3
Fig. 3
MSI tumors have more genes with repeat instability. Box plots of the number of promoters with instability of a) any repeat, b) mononucleotide repeats and the number of exons with instability of c) any repeat, d) mononucleotide repeats in MSI tumors (left boxes, n = 4) and in microsatellite stable genome pairs (right boxes, n = 31). Thick horizontal lines in each box mark the median, edges of boxes correspond to the 25th and 75th percentiles, and whiskers cover 99.3 % of the data’s range. The repeat incidences in each pair of boxes are significantly different from each other within each panel except for the panel a (WRS Test, P = 0.029, P = 0.003, P = 10−4, in panels b, c and d, respectively, after Bonferroni correction)
Fig. 4
Fig. 4
Gene promoters in most cancer pathways are significantly enriched for repeat instability. Box plots of the proportion of promoters in five different cancer-associated signaling pathways with a) unstable repeats in their promoters and b) orphan repeats in their promoters, for normal-normal genome pairs (left boxes, n = 595) and for tumor-matched normal genome pairs (right boxes, n = 35). The pathways are: MAPK (number of genes in the pathway, N = 113), mTOR (N = 44), p53 (N = 98), TGF beta (N = 29), and Wnt (N = 87). Thick horizontal lines in each box mark the median, edges of boxes correspond to the 25th and 75th percentiles, and whiskers cover 99.3 % of the data’s range. In panel a repeat instability is significantly different in tumor genomes for the MAPK, p53, and Wnt signaling pathways (WRS test, P = 0.03, P < 10−8, P < 10−5, respectively, after Bonferroni correction). In panel b repeat instability is significantly different in tumor genomes for the MAPK, mTOR, p53, and Wnt signaling pathways (WRS Test, P < 10−31, P < 10−24, P < 10−9, P < 10−18, respectively after Bonferroni, correction)
Fig. 5
Fig. 5
Exons in the p53 pathway are significantly enriched for repeat instability. Box plots of the number of genes in the p53 pathway with unstable repeats and orphan repeats in their exons, for normal-normal genome pairs (left boxes, n = 595) and for tumor-matched normal genome pairs (right boxes, n = 35). Thick horizontal lines in each box mark the median, edges of boxes correspond to the 25th and 75th percentiles, and whiskers cover 99.3 % of the data’s range. Repeat instability is significantly different between tumor and normal genomes (WRS test, P = 0.03, P < 10−4, respectively, after Bonferroni correction)
Fig. 6
Fig. 6
Schematic illustration of the expression analysis of genes with and without repeat instability. A gene (A, B, C and so on, where n = 18,439) is shown in solid black, if it does not contain any repeat instability (repeat copy number variation, repeat gain, or repeat loss) in its promoter or its exons between tumor and matched normal genomes of a patient (n = 35). It is shown cross-hatched if it contains at least one of these repeat instability types. Only genes with a repeat instability in at least one of the patients are considered for this expression analysis (n = 11,016 genes for promoter repeats, and n = 7531 genes for exonic repeats). For each gene, we computed (i) the mean of its expression level in tumors where the gene shows repeat instability (cross-hatched arrow indicating transcription) and (ii) the mean of its expression in tumors where the gene does not show repeat instability (solid black arrow indicating transcription). We then performed a WSR test to compare the mean expression values between these two groups of genes, the null hypothesis being that the expression level of a gene is not associated with mutations in its tandem repeat in a tumor tissue
Fig. 7
Fig. 7
Genes with repeat instability are downregulated. Box plot of binary logarithm of mean expression levels of those genes with repeat instability (copy number variation, repeat gain, or repeat loss) (left box) and of genes without repeat instability (right box) in tumor genomes. Thick horizontal lines in each box mark the median, edges of boxes correspond to the 25th and 75th percentiles, and whiskers cover 99.3 % of the data’s range. The difference in gene expression is significant (WRS Test, P < 10−350, n = 11,016)
Fig. 8
Fig. 8
Genes with repeat instability are dysregulated in the Wnt, MAPK and p53 pathways. Box plot of binary logarithm of mean expression levels of those genes with repeat instability (copy number variation, repeat gain, or repeat loss) (left box in each pair) and of genes without repeat instability (right box) in tumor genomes, for genes in the Wnt (n = 32, for both boxes), TGF beta (n = 6), MAPK (n = 19), mTOR (n = 38) and p53 (n = 31) signaling pathways. Thick horizontal lines in each box mark the median, edges of boxes correspond to the 25th and 75th percentiles, and whiskers cover 99.7 % of the data’s range. Differences in gene expression are significant for the p53 (WSR test after Bonferroni correction P < 10−4), MAPK (P < 10−5) and Wnt signaling pathways (P = 0.03)

References

    1. Legendre M, Pochet N, Pak T, Verstrepen KJ. Sequence-based estimation of minisatellite and microsatellite repeat variability. Genome Res. 2007;17:1787–1796. doi: 10.1101/gr.6554007. - DOI - PMC - PubMed
    1. Li Y-C, Korol AB, Fahima T, Beiles A, Nevo E. Microsatellites: genomic distribution, putative functions and mutational mechanisms: a review. Mol Ecol. 2002;11:2453–65. doi: 10.1046/j.1365-294X.2002.01643.x. - DOI - PubMed
    1. Schlötterer C. Evolutionary dynamics of microsatellite DNA. Chromosoma. 2000;109:365–371. doi: 10.1007/s004120000089. - DOI - PubMed
    1. López Castel A, Cleary JD, Pearson CE. Repeat instability as the basis for human diseases and as a potential target for therapy. Nat Rev Mol Cell Biol. 2010;11:165–170. doi: 10.1038/nrm2854. - DOI - PubMed
    1. Gemayel R, Vinces MD. Legendre M. Variable Tandem Repeats Accelerate Evolution of Coding and Regulatory Sequences. Annu Rev Genet: Verstrepen KJ; 2010. - PubMed

Publication types

MeSH terms

Substances