. 2015 Sep 16:12:78.
doi: 10.1186/s12977-015-0203-3.

Intracellular expression of Tat alters mitochondrial functions in T cells: a potential mechanism to understand mitochondrial damage during HIV-1 replication

Affiliations

Intracellular expression of Tat alters mitochondrial functions in T cells: a potential mechanism to understand mitochondrial damage during HIV-1 replication

Sara Rodríguez-Mora et al. Retrovirology. .

Abstract

Background: HIV-1 replication results in mitochondrial damage that is enhanced during antiretroviral therapy (ART). The onset of HIV-1 replication is regulated by viral protein Tat, a 101-residue protein codified by two exons that elongates viral transcripts. Although the first exon of Tat (aa 1-72) forms itself an active protein, the presence of the second exon (aa 73-101) results in a more competent transcriptional protein with additional functions.

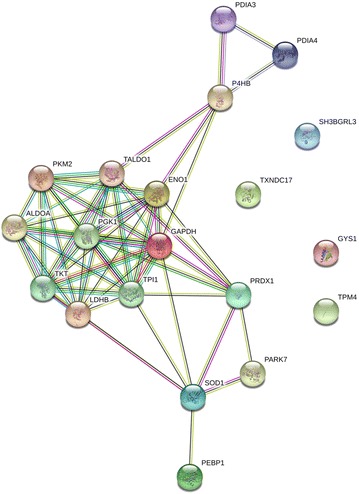
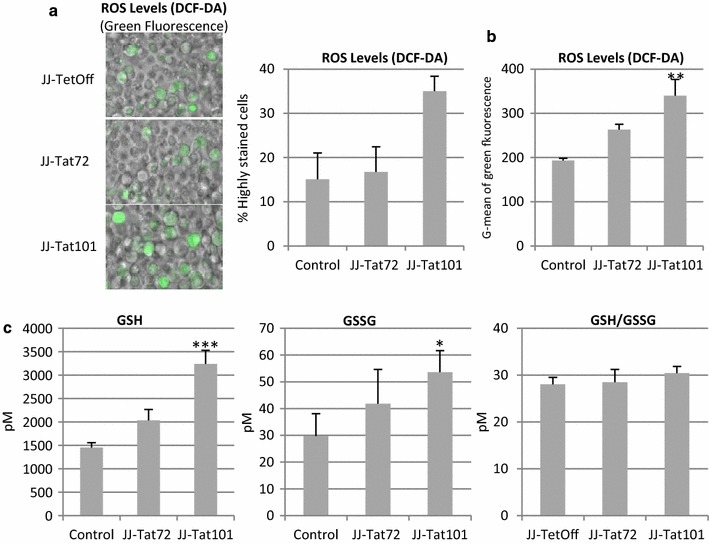
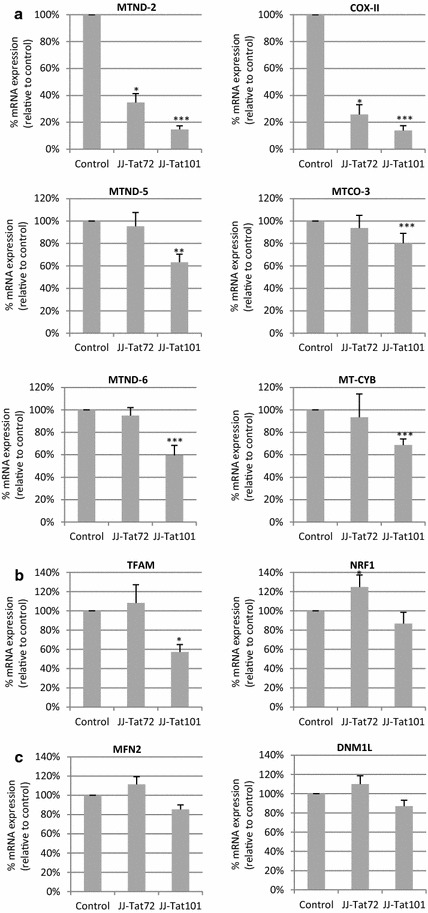
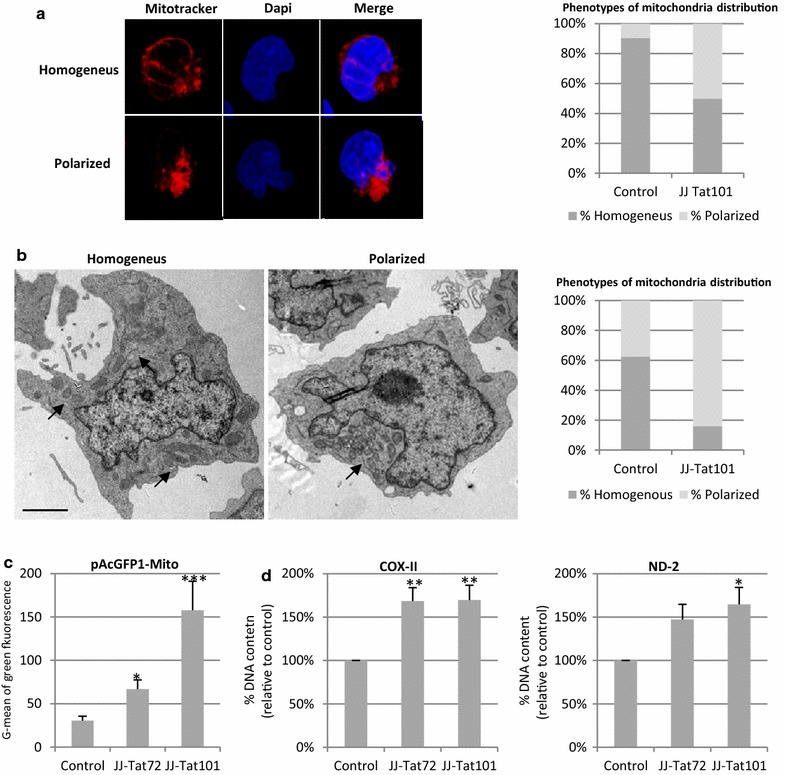
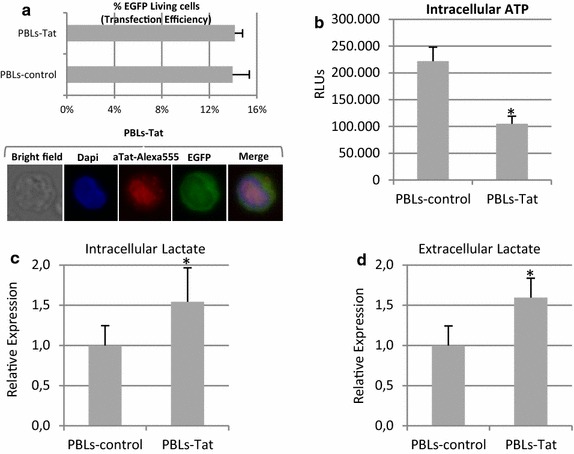
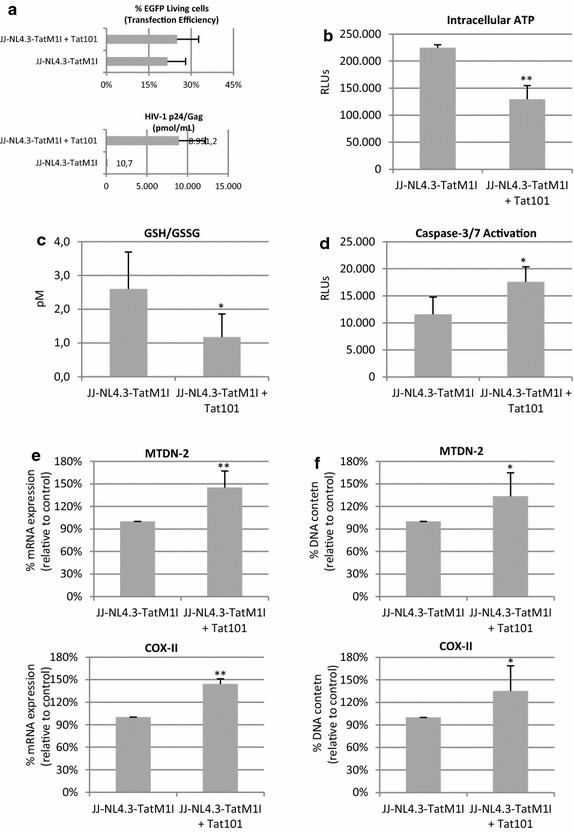
Results: Mitochondrial overall functions were analyzed in Jurkat cells stably expressing full-length Tat (Tat101) or one-exon Tat (Tat72). Representative results were confirmed in PBLs transiently expressing Tat101 and in HIV-infected Jurkat cells. The intracellular expression of Tat101 induced the deregulation of metabolism and cytoskeletal proteins which remodeled the function and distribution of mitochondria. Tat101 reduced the transcription of the mtDNA, resulting in low ATP production. The total amount of mitochondria increased likely to counteract their functional impairment. These effects were enhanced when Tat second exon was expressed.

Conclusions: Intracellular Tat altered mtDNA transcription, mitochondrial content and distribution in CD4+ T cells. The importance of Tat second exon in non-transcriptional functions was confirmed. Tat101 may be responsible for mitochondrial dysfunctions found in HIV-1 infected patients.


Figures

Fig. 1
Fig. 1
Network of predicted interactions between mitochondria-related proteins deregulated in Jurkat-Tat101. Medium confidence score level was 0.400. Data supporting protein–protein interactions derived from experimental studies (dark purple lines), homology (light purple lines), databases (light blue lines), text mining (light green lines), concurrence (dark blue lines) and co-expression (black lines). Node colour is arbitrary. Differences in protein levels are specified in Table 1
Fig. 2
Fig. 2
Quantification of citrate synthase activity, mitochondria respiratory capacity and lactate levels in Jurkat-Tat101 cells. a Activity of the citrate synthase measured with commercial enzymatic assays in Jurkat-Tat72 (JJ-Tat72), Jurkat-Tat101 (JJ-Tat101) vs control cells. One citrate unit is equivalent to a μmole/mL/min. b ATP production was measured using a chemiluminescence-based assay. c Activity of the complex-I and complex-V of the respiratory chain was measured in Jurkat-Tat72, Jurkat-Tat101 and control cells in mg/mL/min and it was normalized according to mitochondria amount indirectly measured as the activity of the citrate synthase enzyme. d Lactate levels were measured in intracellular and supernatant samples and concentration was expressed in ng/μl (left and right panels, respectively) from Jurkat-Tat72, Jurkat-Tat101 vs control cells. All data shown are media and standard error of the mean (SEM) from at least three independent experiments. Statistical significance was calculated by Kruskal–Wallis test and post hoc multiple comparisons were performed with Dunn’s multiple comparison analysis (*p < 0.05 and **p < 0.01 vs control)
Fig. 3
Fig. 3
Intracellular ROS generation and glutathione levels in Jurkat-Tat101 cells. a Microscopy analysis of intracellular ROS levels measured by DCF-DA staining method. Representative fields of living Jurkat-Tat72, Jurkat-Tat101 and control cells are shown. Acquisition conditions remained the same for each cellular type. The graph shows the number of cells with saturated signal for green laser, from three independent experiments. b Cytometry analysis of DCF-DA stained cells. Graph shows G-mean of green fluorescence intensity of the living cell population from three independent experiments. c Intracellular concentration of reduced (GSH), oxidized (GSSG) and ratio of total glutathione (GSH/GSSG) were measured in Jurkat-Tat72, Jurkat-Tat101 and control cells. Data shown are media and SEM from at least three independent experiments. Kruskal–Wallis test with Dunn’s Multiple Comparison post hoc analysis was performed for statistical analysis (*p < 0.05 and ***p < 0.001 vs control)
Fig. 4
Fig. 4
Apoptosis induction in non-stimulated Jurkat-Tat101 cells. a Percentage of Jurkat-Tat72, Jurkat-Tat101 and control cells showing an apoptotic phenotype from three independent experiments analyzed by confocal microscopy. b Representative images of living and apoptotic cells. Cells were fixed and the nuclei were stained with Dapi. c Caspase-3/-7 activation was measured by a chemiluminiscence-based test in Jurkat-Tat72, Jurkat-Tat101 and control cells under basal conditions. Relative luciferase units (RLUs) after total protein normalization are shown. d Percentage of apoptosis committed cells expressing external phosphatidylserine. The graph shows the cytometry analysis of Annexin-V-PE stained cells. e Cytometry analysis of doubly stained cells for Annexin-V-PE and DCF-DA-FITC. Graph on the left shows the percentage of double stained cells. Graph on the right shows G-mean of green fluorescence intensity in double stained cells. All graphs show media and SEM from at least three independent experiments. Kruskal–Wallis test with Dunn’s multiple comparison post hoc analysis was performed for statistical analysis (*p < 0.05, **p < 0.001)
Fig. 5
Fig. 5
Effect of Tat on the transcription of mt-DNA and fusion/fission genes. a qPCR analysis of mRNAs levels from the mtDNA-encoded genes COX-II, MTND-2, MTND-5, MTND-6, MT-CYB and MTCO-3. b qRT-PCR analysis of mRNAs levels from nuclear DNA-encoded genes TFAM and NRF1. c qRT-PCR analysis of nuclear-encoded mRNAs from MFN2 and DNM1L genes, which are involved in mitochondria fusion and fission, respectively. Total mRNA from control cells, Jurkat-Tat72, and Jurkat-Tat101 cells was analyzed. Nuclear S18 mRNA expression was used as house-keeping gene. All data shown are media and SEM from at least three independent experiments. Statistical significance was calculated by Kruskal–Wallis test with Dunn’s multiple comparison post hoc analysis (*p < 0.05, **p < 0.01 ***p < 0.001 vs control)
Fig. 6
Fig. 6
Expression of an array of nuclear-encoded genes related to mitochondria in Jurkat-Tat101 cells. The expression of mitochondrial genes encoded by nuclear DNA was analyzed by qRT-PCR in total RNA from Jurkat-Tat101 cells versus controls cells, using RT 2 Profiler™ PCR Array Human Mitochondria. a Relative expression levels of mitochondrial-related genes deregulated at least ±2.0-fold in Jurkat-Tat101 cells versus control cells. Table 2 includes the relative gene expression levels of 84 mitochondrial-genes included in the analysis. b Network of predicted interactions between mitochondria-related genes deregulated ±2.0-fold in Jurkat-Tat101. Medium confidence score level was 0.400. Data supporting protein–protein interactions derived from experimental studies (dark purple lines), homology (light purple lines), databases (light blue lines), text mining (light green lines), concurrence (dark blue lines) and co-expression (black lines). Node colour is arbitrary
Fig. 7
Fig. 7
Effect of intracellular Tat expression on cellular polarization and the expression of cytoskeleton-related proteins. a Network of predicted interactions between cytoskeletal network proteins deregulated in Jurkat-Tat101 vs control cells (as specified in Table 3). Medium confidence score level was chosen (0.400). Data supporting protein–protein interactions derived from experimental studies (dark purple lines), homology (light purple lines), databases (light blue lines), text mining (light green lines), concurrence (dark blue lines) and co-expression (black lines). Node colour is arbitrary. b Rac1 and RhoA GTPases activations were measured using a luminescence-based assay. Data shown are absolute RLUs from three independent experiments. c Cdc42 GTPase activation was measured in protein extracts using a colorimetric-based assay. Data shown are absolute absorbance at 490 nm from three independent experiments. d Cellular polarization was studied by immunofluorescence in Jurkat-Tat72, Jurkat-Tat101 and control cells adhered to fibronectin using an antibody against α-tubulin and a secondary antibody conjugated with Alexa-555. e Analysis of migration capacity in Jurkat-Tat72 and Jurkat-Tat101 in comparison with control cells in the absence of any migratory stimuli. The relative increase of migrated events in comparison with control cells from three independent experiments is shown. Statistical significance was calculated with Kruskal–Wallis test with Dunn’s multiple comparison test (***p < 0.001 vs control)
Fig. 8
Fig. 8
Effect of intracellular Tat expression on mitochondrial mass and its subcellular distribution. a Mitochondria distribution within Jurkat-101 vs control cells was analyzed by microscopy after staining with Mitotracker probe. The nucleus was stained with DAPI. Representative images of a cell with homogeneous and polarized mitochondrial mass distribution are shown. The graph includes the percentage of each phenotype in Jurkat-Tat101 and control cells. b Mitochondria network distribution was also analyzed by electron microscopy using ultrathin sections. Representative images from control and Jurkat-Tat101 cells showing the homogeneous and polarized mitochondrial network distribution are shown. Scale bar corresponds to 200 nm. The graph shows the percentage of each phenotype in Jurkat-Tat101 and control cells. c Expression of the nuclear-encoded VIII sunit of the cytochrome c oxidase was analyzed by flow cytometry in Jurkat-Tat72, Jurkat-Tat101 and control cells transfected with a vector coding for this protein bound to GFP (pAcGFP1-Mito). Graph shows G-mean of green fluorescence intensity of the living cell population from three independent experiments. Statistical significance was calculated with Kruskal–Wallis test with Dunn’s multiple comparison test (*p < 0.05 and ***p < 0.001). d qPCR measurement of mitochondria DNA matching with regions coding for COX-II and MTND-2 genes. Nuclear-encoded DNA S18 was used as house-keeping gene. Data shown are media and SEM from three independent experiments. Statistical significance was calculated with Kruskal–Wallis test with Dunn’s multiple comparison test (*p < 0.05 and **p < 0.01)
Fig. 9
Fig. 9
Intracellular ATP production and intracellular lactate levels and release in PBLs expressing Tat101. Resting PBLs were transiently transfected with vectors CMV-Tat101 or pcDNA3, as negative control, along with pEGFP expression vector, as control of transfection efficiency. a Flow cytometry quantification of the percentage of living cells expressing EGFP was used to analyze transfection efficiency. Intracellular expression of Tat and nuclear subcellular localization were confirmed by immunofluorescence using a monoclonal antibody against Tat and a secondary antibody conjugated to Alexa 546. DAPI was used for nuclear staining. b ATP production was measured by chemiluminescence using a commercial assay. Data shown are RLUs mean and SEM of concentration from five independent experiments. c Relative intracellular lactate production measured in PBLs expressing Tat versus control PBLs. Data shown are relative mean and SEM of concentration from five independent experiments. d Relative release of lactate to the culture medium measured in the same PBLs expressing Tat used to measure intracellular lactate. Statistical significance was calculated by Mann–Whitney test (*p < 0.05)
Fig. 10
Fig. 10
Intracellular ATP levels, GSH/GSSG ratio, caspase-3/7 activation, mtDNA transcription and mitochondrial content in HIV-1 infected T lymphocytes. PBLs were infected pNL4.3-TatM1I vector along with pcDNA3 or with pCMV-Tat101 vector. pEGFP was co-transfetion as a control of transfection efficiency. a Flow cytometry quantification of the percentage of living cells expressing EGFP was used to analyze transfection efficiency (upper panel). Quantification of p24/Gag in culture supernatant was used as control of infection (lower panel). b Intracellular ATP production. c Intracellular concentration of GSH/GSSG. d Caspase-3/7 activation. Intracellular ATP, GSH/GSSG ratio and caspase-3/7 activation were measured by chemiluminescence using commercial assays. e qPCR analysis of mRNAs levels from the mtDNA-encoded genes MTND-2 and COX-II. mRNA levels of nucelar-encoded S18 expression were used as house-keeping gene. f qPCR analysis of mitochondria DNA matching with regions coding for COX-II and MTND-2 genes. Nuclear-encoded DNA S18 was used as house-keeping gene. Data shown are mean and SEM from three independent experiments. Statistical significance was calculated by Mann–Whitney test or Kolmogorov–Smirnov test (*p < 0.05, **p < 0.01)

References

    1. Stevenson M. HIV-1 pathogenesis. Nat Med. 2003;9:853–860. doi: 10.1038/nm0703-853. - DOI - PubMed
    1. Appay V, Almeida JR, Sauce D, Autran B, Papagno L. Accelerated immune senescence and HIV-1 infection. Exp Gerontol. 2007;42:432–437. doi: 10.1016/j.exger.2006.12.003. - DOI - PubMed
    1. Bohr VA, Stevnsner T, De Souza-Pinto NC. Mitochondrial DNA repair of oxidative damage in mammalian cells. Gene. 2002;286:127–134. doi: 10.1016/S0378-1119(01)00813-7. - DOI - PubMed
    1. Trifunovic A, Wredenberg A, Falkenberg M, Spelbrink JN, Rovio AT, Bruder CE, et al. Premature ageing in mice expressing defective mitochondrial DNA polymerase. Nature. 2004;429:417–423. doi: 10.1038/nature02517. - DOI - PubMed
    1. Macho A, Castedo M, Marchetti P, Aguilar JJ, Decaudin D, Zamzami N, et al. Mitochondrial dysfunctions in circulating T lymphocytes from human immunodeficiency virus-1 carriers. Blood. 1995;86:2481–2487. - PubMed

Publication types

MeSH terms

Substances

LinkOut - more resources