

Placental phenotype and resource allocation to fetal growth are modified by the timing and degree of hypoxia during mouse pregnancy
- PMID: 26377136
- PMCID: PMC4771776
- DOI: 10.1113/JP271057
Placental phenotype and resource allocation to fetal growth are modified by the timing and degree of hypoxia during mouse pregnancy
Abstract
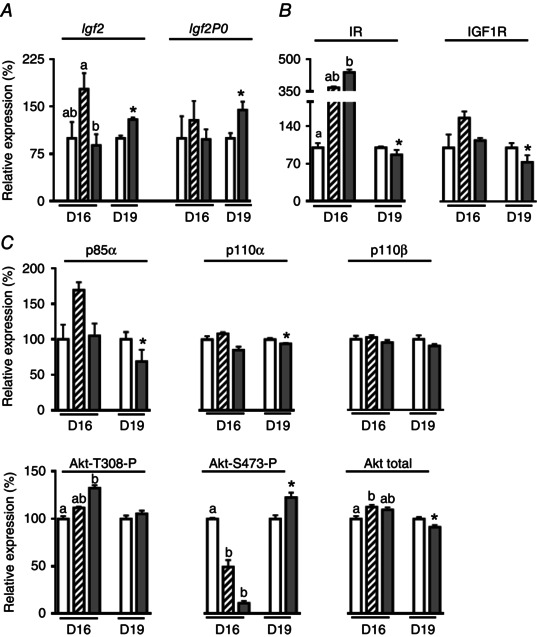
The placenta adapts its transport capacity to nutritional cues developmentally, although relatively little is known about placental transport phenotype in response to hypoxia, a major cause of fetal growth restriction. The present study determined the effects of both moderate hypoxia (13% inspired O2) between days (D)11 and D16 or D14 and D19 of pregnancy and severe hypoxia (10% inspired O2) from D14 to D19 on placental morphology, transport capacity and fetal growth on D16 and D19 (term∼D20.5), relative to normoxic mice in 21% O2. Placental morphology adapted beneficially to 13% O2; fetal capillary volume increased at both ages, exchange area increased at D16 and exchange barrier thickness reduced at D19. Exposure to 13% O2 had no effect on placental nutrient transport on D16 but increased placental uptake and clearance of (3)H-methyl-D-glucose at D19. By contrast, 10% O2 impaired fetal vascularity, increased barrier thickness and reduced placental (14)C-methylaminoisobutyric acid clearance at D19. Consequently, fetal growth was only marginally affected in 13% O2 (unchanged at D16 and -5% at D19) but was severely restricted in 10% O2 (-21% at D19). The hypoxia-induced changes in placental phenotype were accompanied by altered placental insulin-like growth factor (IGF)-2 expression and insulin/IGF signalling, as well as by maternal hypophagia depending on the timing and severity of the hypoxia. Overall, the present study shows that the mouse placenta can integrate signals of oxygen and nutrient availability, possibly through the insulin-IGF pathway, to adapt its phenotype and optimize maternal resource allocation to fetal growth during late pregnancy. It also suggests that there is a threshold between 13% and 10% inspired O2 at which these adaptations no longer occur.
© 2015 The Authors. The Journal of Physiology published by John Wiley & Sons Ltd on behalf of The Physiological Society.
Figures


Similar articles
-
Adaptations in placental phenotype depend on route and timing of maternal dexamethasone administration in mice.Biol Reprod. 2013 Oct 4;89(4):80. doi: 10.1095/biolreprod.113.109678. Print 2013 Oct. Biol Reprod. 2013. PMID: 23986571
-
Corticosterone alters materno-fetal glucose partitioning and insulin signalling in pregnant mice.J Physiol. 2015 Mar 1;593(5):1307-21. doi: 10.1113/jphysiol.2014.287177. Epub 2015 Jan 29. J Physiol. 2015. PMID: 25625347 Free PMC article.
-
Maternal corticosterone regulates nutrient allocation to fetal growth in mice.J Physiol. 2012 Nov 1;590(21):5529-40. doi: 10.1113/jphysiol.2012.239426. Epub 2012 Aug 28. J Physiol. 2012. PMID: 22930269 Free PMC article.
-
Placental phenotype and the insulin-like growth factors: resource allocation to fetal growth.J Physiol. 2017 Aug 1;595(15):5057-5093. doi: 10.1113/JP273330. Epub 2017 May 23. J Physiol. 2017. PMID: 28337745 Free PMC article. Review.
-
Placental hypoxia: What have we learnt from small animal models?Placenta. 2021 Sep 15;113:29-47. doi: 10.1016/j.placenta.2021.03.018. Epub 2021 Apr 20. Placenta. 2021. PMID: 34074553 Review.
Cited by
-
Effect of high altitude on human placental amino acid transport.J Appl Physiol (1985). 2020 Jan 1;128(1):127-133. doi: 10.1152/japplphysiol.00691.2019. Epub 2019 Dec 5. J Appl Physiol (1985). 2020. PMID: 31804891 Free PMC article.
-
Circulating syndecan-1 is reduced in pregnancies with poor fetal growth and its secretion regulated by matrix metalloproteinases and the mitochondria.Sci Rep. 2021 Aug 16;11(1):16595. doi: 10.1038/s41598-021-96077-1. Sci Rep. 2021. PMID: 34400721 Free PMC article.
-
Placenta-specific Slc38a2/SNAT2 knockdown causes fetal growth restriction in mice.Clin Sci (Lond). 2021 Sep 17;135(17):2049-2066. doi: 10.1042/CS20210575. Clin Sci (Lond). 2021. PMID: 34406367 Free PMC article.
-
Placental adaptations supporting fetal growth during normal and adverse gestational environments.Exp Physiol. 2023 Mar;108(3):371-397. doi: 10.1113/EP090442. Epub 2022 Dec 9. Exp Physiol. 2023. PMID: 36484327 Free PMC article. Review.
-
At Term, XmO and XpO Mouse Placentas Show Differences in Glucose Metabolism in the Trophectoderm-Derived Outer Zone.Front Cell Dev Biol. 2017 Jun 21;5:63. doi: 10.3389/fcell.2017.00063. eCollection 2017. Front Cell Dev Biol. 2017. PMID: 28680878 Free PMC article.
References
-
- Ali KZM, Burton GJ, Morad N & Ali ME (1996). Does hypercapillarization influence the branching pattern of terminal villi in the human placenta at high altitude? Placenta 17, 677–682. - PubMed
-
- Bacon BJ, Gilbert RD, Kaufmann P, Smith AD, Trevino FT & Longo LD (1984). Placental anatomy and diffusing capacity in guinea pigs following long‐term maternal hypoxia. Placenta 5, 475–487. - PubMed
-
- Burton GJ & Fowden AL (2012). Review: the placenta and developmental programming: balancing fetal nutrient demands with maternal resource allocation. Placenta 33, S23–S27. - PubMed
-
- Cetin I (2003). Placental transport of amino acids in normal and growth‐restricted pregnancies. Eur J Obstet Gynecol Reprod Biol 110 (Suppl 1), S50–S54. - PubMed
Publication types
MeSH terms
Substances
Grants and funding
LinkOut - more resources
Full Text Sources
Other Literature Sources
Miscellaneous