

Some Health States Are Better Than Others: Using Health State Rank Order to Improve Probabilistic Analyses
- PMID: 26377369
- PMCID: PMC4794424
- DOI: 10.1177/0272989X15605091
Some Health States Are Better Than Others: Using Health State Rank Order to Improve Probabilistic Analyses
Abstract
Background: Probabilistic sensitivity analyses (PSA) may lead policy makers to take nonoptimal actions due to misestimates of decision uncertainty caused by ignoring correlations. We developed a method to establish joint uncertainty distributions of quality-of-life (QoL) weights exploiting ordinal preferences over health states.
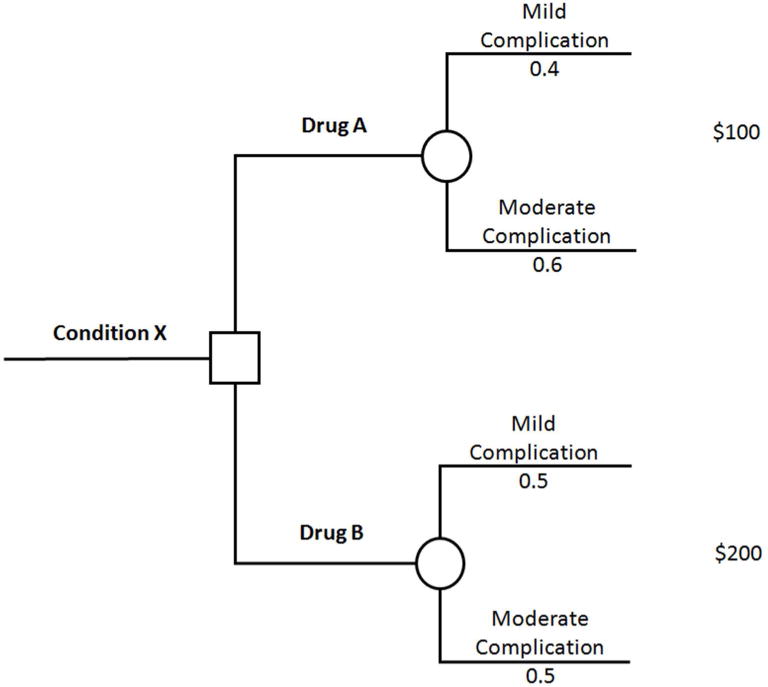
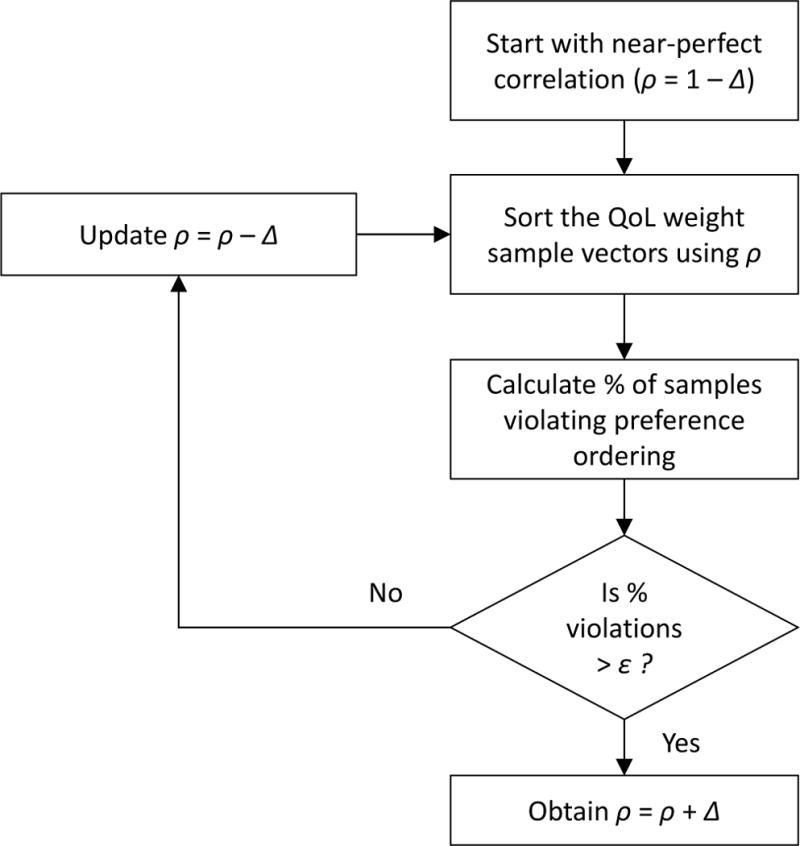
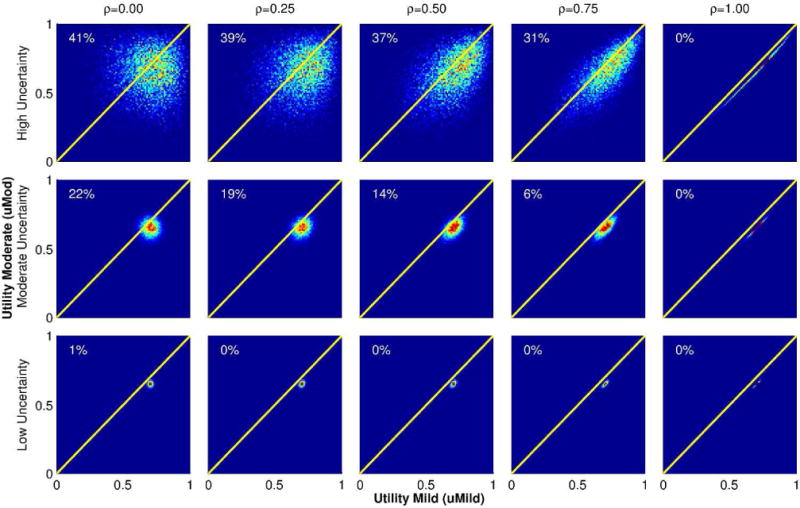
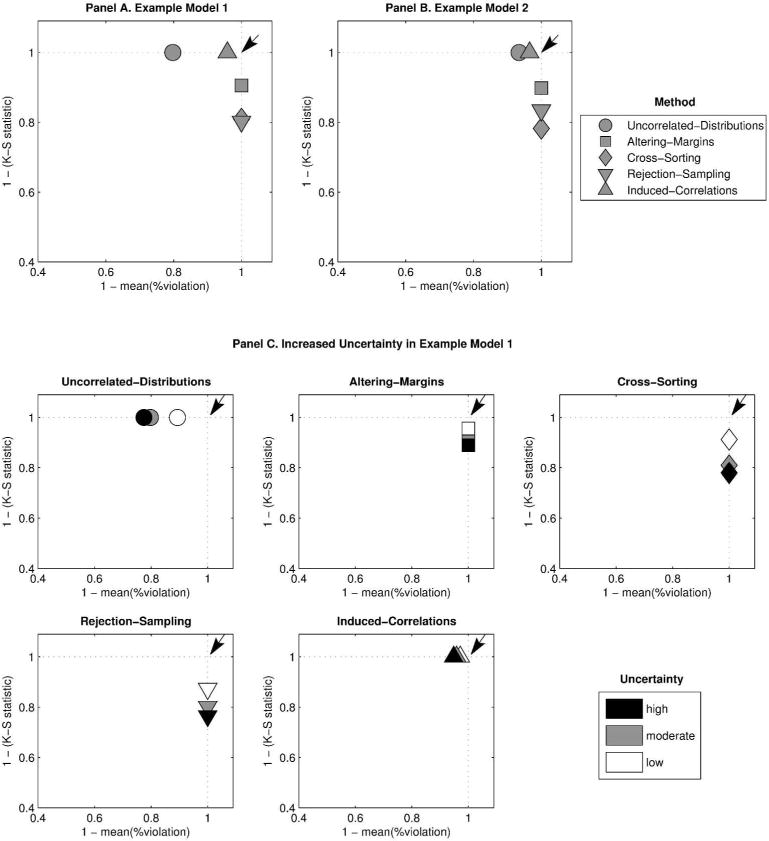
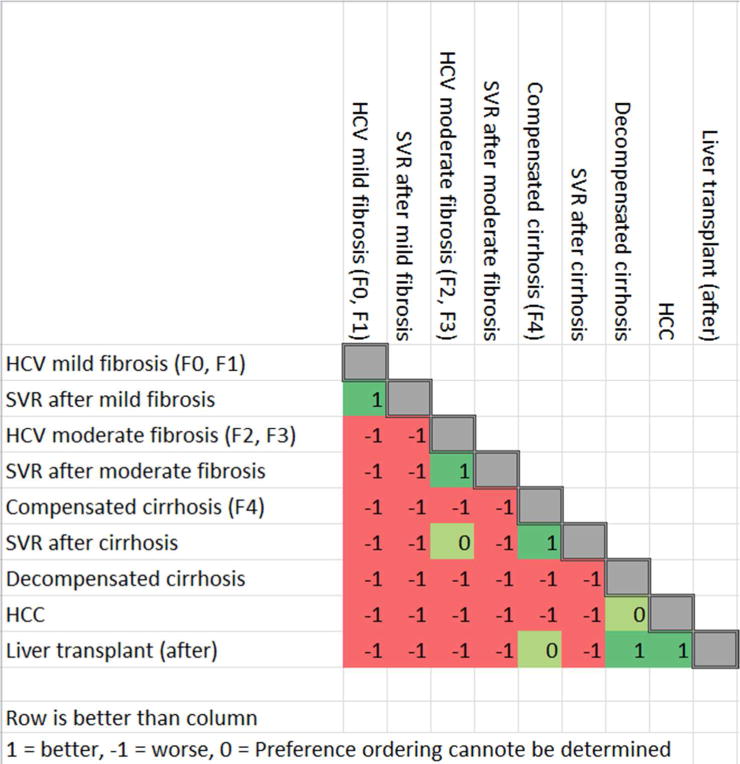
Methods: Our method takes as inputs independent, univariate marginal distributions for each QoL weight and a preference ordering. It establishes a correlation matrix between QoL weights intended to preserve the ordering. It samples QoL weight values from their distributions, ordering them with the correlation matrix. It calculates the proportion of samples violating the ordering, iteratively adjusting the correlation matrix until this proportion is below an arbitrarily small threshold. We compare our method with the uncorrelated method and other methods for preserving rank ordering in terms of violation proportions and fidelity to the specified marginal distributions along with PSA and expected value of partial perfect information (EVPPI) estimates, using 2 models: 1) a decision tree with 2 decision alternatives and 2) a chronic hepatitis C virus (HCV) Markov model with 3 alternatives.
Results: All methods make tradeoffs between violating preference orderings and altering marginal distributions. For both models, our method simultaneously performed best, with largest performance advantages when distributions reflected wider uncertainty. For PSA, larger changes to the marginal distributions induced by existing methods resulted in differing conclusions about which strategy was most likely optimal. For EVPPI, both preference order violations and altered marginal distributions caused existing methods to misestimate the maximum value of seeking additional information, sometimes concluding that there was no value.
Conclusions: Analysts can characterize the joint uncertainty in QoL weights to improve PSA and value-of-information estimates using Open Source implementations of our method.
Keywords: bias; correlated parameters; expected value of partial perfect information; joint distribution; parameter correlation; probabilistic sensitivity analysis; value of information.
© The Author(s) 2015.
Figures
Similar articles
-
Cost-Effectiveness Uncertainty Analysis Methods: A Comparison of One-Way Sensitivity, Analysis of Covariance, and Expected Value of Partial Perfect Information.Med Decis Making. 2015 Jul;35(5):596-607. doi: 10.1177/0272989X14556510. Epub 2014 Oct 27. Med Decis Making. 2015. PMID: 25349188
-
Need for speed: an efficient algorithm for calculation of single-parameter expected value of partial perfect information.Value Health. 2013 Mar-Apr;16(2):438-48. doi: 10.1016/j.jval.2012.10.018. Epub 2013 Jan 26. Value Health. 2013. PMID: 23538197
-
Expected value of perfect information: an empirical example of reducing decision uncertainty by conducting additional research.Value Health. 2008 Dec;11(7):1070-80. doi: 10.1111/j.1524-4733.2008.00389.x. Value Health. 2008. PMID: 19602213
-
When is enough evidence enough? - Using systematic decision analysis and value-of-information analysis to determine the need for further evidence.Z Evid Fortbild Qual Gesundhwes. 2013;107(9-10):575-84. doi: 10.1016/j.zefq.2013.10.020. Epub 2013 Nov 12. Z Evid Fortbild Qual Gesundhwes. 2013. PMID: 24315327 Review.
-
Sensitivity analysis in economic evaluation: an audit of NICE current practice and a review of its use and value in decision-making.Health Technol Assess. 2009 Jun;13(29):iii, ix-xi, 1-61. doi: 10.3310/hta13290. Health Technol Assess. 2009. PMID: 19500484 Review.
Cited by
-
Using Cerebrospinal Fluid Biomarker Testing to Target Treatment to Patients with Mild Cognitive Impairment: A Cost-Effectiveness Analysis.Pharmacoecon Open. 2018 Sep;2(3):309-323. doi: 10.1007/s41669-017-0054-z. Pharmacoecon Open. 2018. PMID: 29623628 Free PMC article.
-
An Introductory Tutorial on Cohort State-Transition Models in R Using a Cost-Effectiveness Analysis Example.Med Decis Making. 2023 Jan;43(1):3-20. doi: 10.1177/0272989X221103163. Epub 2022 Jun 30. Med Decis Making. 2023. PMID: 35770931 Free PMC article.
-
Simulating Study Data to Support Expected Value of Sample Information Calculations: A Tutorial.Med Decis Making. 2022 Feb;42(2):143-155. doi: 10.1177/0272989X211026292. Epub 2021 Aug 13. Med Decis Making. 2022. PMID: 34388954 Free PMC article.
-
Cost-effectiveness of Digital Breast Tomosynthesis in Population-based Breast Cancer Screening: A Probabilistic Sensitivity Analysis.Radiology. 2020 Oct;297(1):40-48. doi: 10.1148/radiol.2020192505. Epub 2020 Aug 4. Radiology. 2020. PMID: 32749212 Free PMC article.
-
Populationwide Screening for Chronic Kidney Disease: A Cost-Effectiveness Analysis.JAMA Health Forum. 2024 Nov 1;5(11):e243892. doi: 10.1001/jamahealthforum.2024.3892. JAMA Health Forum. 2024. PMID: 39514193 Free PMC article.
References
-
- Claxton K. The irrelevance of inference: a decision-making approach to the stochastic evaluation of health care technologies. J Health Econ [Internet] 1999 Jun;18(3):341–64. Available from: http://www.ncbi.nlm.nih.gov/pubmed/10537899. - PubMed
-
- Claxton K, Cohen JT, Neumann PJ. When is evidence sufficient? Health Aff [Internet] 2005;24(1):93–101. Available from: http://www.ncbi.nlm.nih.gov/pubmed/23796298. - PubMed
-
- Briggs A, Weinstein MC, Fenwick EL, Karnon J, Sculpher MJ, Paltiel D. Model parameter estimation and uncertainty analysis: A report of the ISPOR-SMDM Modeling Good Research Practices Task Force Working Group-6. Med Decis Mak [Internet] 2012;32(5):722–732. [cited 2012 Sep 19] Available from: http://www.ncbi.nlm.nih.gov/pubmed/22990087. - PubMed
-
- Brennan A, Kharroubi SA, Chilcott J, O’Hagan A. Presented at the 24th Annual Meeting of the Society for Medical Decision Making. Washington; 2002. A two level Monte Carlo approach to calculation expected value of sample information: how to value a research design.
-
- Ades A, Lu G, Claxton K. Expected value of sample information calculations in medical decision modeling. Med Decis Mak [Internet] 2004;24(2):207–27. [cited 2012 Nov 18] Available from: http://www.ncbi.nlm.nih.gov/pubmed/15090106. - PubMed
Publication types
MeSH terms
Grants and funding
LinkOut - more resources
Full Text Sources
Other Literature Sources
Research Materials
Miscellaneous
