. 2016 May;100(5):683-7.
doi: 10.1136/bjophthalmol-2015-307341. Epub 2015 Sep 16.

Individualised risk assessment for diabetic retinopathy and optimisation of screening intervals: a scientific approach to reducing healthcare costs

Affiliations

Individualised risk assessment for diabetic retinopathy and optimisation of screening intervals: a scientific approach to reducing healthcare costs

S H Lund et al. Br J Ophthalmol. 2016 May.

Abstract

Objective: To validate a mathematical algorithm that calculates risk of diabetic retinopathy progression in a diabetic population with UK staging (R0-3; M1) of diabetic retinopathy. To establish the utility of the algorithm to reduce screening frequency in this cohort, while maintaining safety standards.

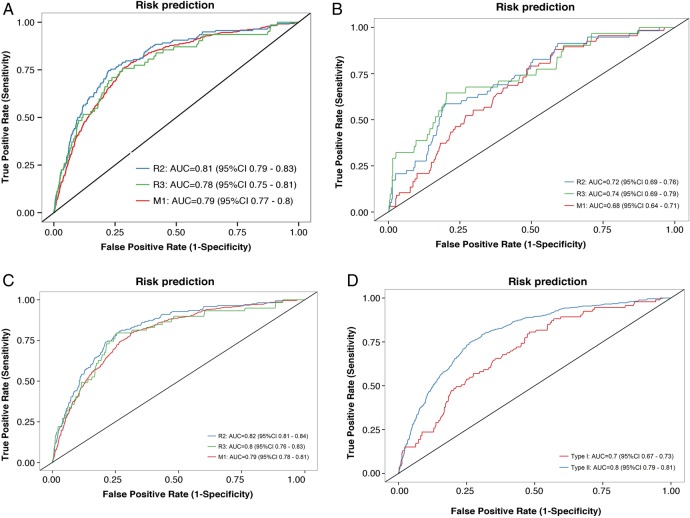
Research design and methods: The cohort of 9690 diabetic individuals in England, followed for 2 years. The algorithms calculated individual risk for development of preproliferative retinopathy (R2), active proliferative retinopathy (R3A) and diabetic maculopathy (M1) based on clinical data. Screening intervals were determined such that the increase in risk of developing certain stages of retinopathy between screenings was the same for all patients and identical to mean risk in fixed annual screening. Receiver operating characteristic curves were drawn and area under the curve calculated to estimate the prediction capability.

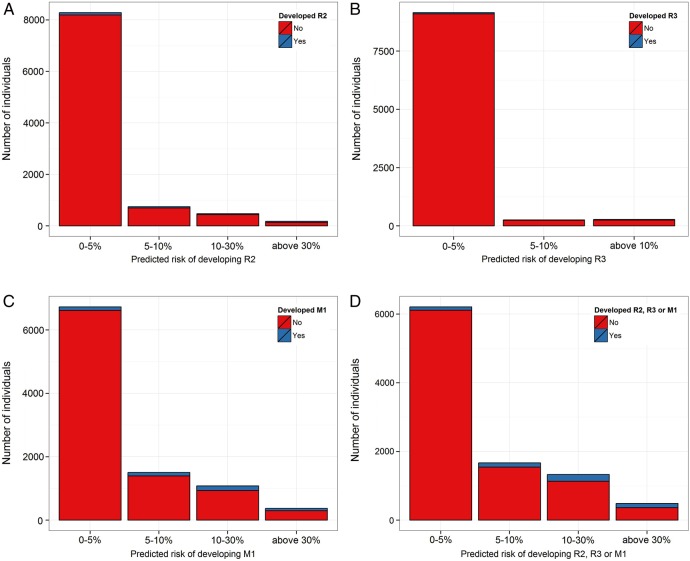
Results: The algorithm predicts the occurrence of the given diabetic retinopathy stages with area under the curve =80% for patients with type II diabetes (CI 0.78 to 0.81). Of the cohort 64% is at less than 5% risk of progression to R2, R3A or M1 within 2 years. By applying a 2 year ceiling to the screening interval, patients with type II diabetes are screened on average every 20 months, which is a 40% reduction in frequency compared with annual screening.

Conclusions: The algorithm reliably identifies patients at high risk of developing advanced stages of diabetic retinopathy, including preproliferative R2, active proliferative R3A and maculopathy M1. Majority of patients have less than 5% risk of progression between stages within a year and a small high-risk group is identified. Screening visit frequency and presumably costs in a diabetic retinopathy screening system can be reduced by 40% by using a 2 year ceiling. Individualised risk assessment with 2 year ceiling on screening intervals may be a pragmatic next step in diabetic retinopathy screening in UK, in that safety is maximised and cost reduced by about 40%.

Keywords: Clinical Trial; Diagnostic tests/Investigation; Epidemiology; Public health; Retina.


Figures

Figure 1
Figure 1
(A) ROC (receiver operating characteristic) curves for predicting R2 (preproliferative retinopathy), R3A (active proliferative retinopathy) or M1 (diabetic maculopathy), based on the risk estimates of the algorithm. Patients with type I and type II diabetes together. Curves for R2 are coloured in blue, R3A in green and M1 in red. The AUC (area under curve) was: R2: 0.81 (CI 0.79 to 0.83), R3A: 0.78 (CI 0.75 to 0.81), M1: 0.79 (CI 0.77 to 0.80). (B) ROC curves for predicting R2, R3A or M1, based on the risk estimates of the algorithm. Patients with type I diabetes only. Curves for R2 are coloured in blue, R3A in green and M1 in red. The AUC was: R2: 0.72 (CI 0.69 to 0.76), R3A: 0.74 (CI 0.69 to 0.79), M1: 0.68 (CI 0.64 to 0.71). (C) ROC curves for risk predicting of R2, R3A or M1 based on the risk estimates of the algorithm. Patients with type II diabetes only. Curves for R2 are coloured in blue, R3A in green and M1 in red. The AUC was: R2: 0.83 (CI 0.81 to 0.84), R3A: 0.80 (CI 0.76 to 0.83), M1: 0.79 (CI 0.78 to 0.81). (D) ROC curves for predicting any of R2, R3A or M1 based on the risk estimates of the algorithm. Coloured in blue are patients with type II diabetes, and patients with type I diabetes are shown in red. The AUC is 70% for patients with type I diabetes (CI 0.67 to 0.73) and 80% for patients with type II diabetes (CI 0.78 to 0.81).
Figure 2
Figure 2
(A) Distribution of the estimated adjusted risk of developing R2 (preproliferative retinopathy) within 2 years according to the algorithm. The height of the bar represents the number of individuals that fall within the corresponding risk group. Within 2 years, 8286 had 0–5% risk, 747 had 5–10% and 654 had 10–30% risk of developing R2. (B) Distribution of the estimated adjusted risk of developing R3A (proliferative diabetic retinopathy) within 2 years according to the algorithm. The height of the bar represents the number of individuals that fall within the corresponding risk group. Within 2 years, 9150 had 0–5% risk, 258 had 5–10% and 279 had 10–30% risk of developing R3A. (C) Distribution of the estimated adjusted risk of developing M1 (diabetic macular oedema) within 2 years according to the algorithm. The height of the bar represents the number of individuals that fall within the corresponding risk group. Within 2 years 6728 had 0–5% risk, 1506 had 5–10% and 1453 had 10–30% risk of developing M1. (D) Distribution of the estimated adjusted risk of developing any of R2 (moderate or severe preproliferative retinopathy), R3A (proliferative retinopathy) or M1 (diabetic maculopathy) within 2 years according to the algorithm. The height of the bar represents the number of individuals that fall within the corresponding risk group. Within 2 years 6207 had 0–5% risk, 1666 had 5–10% and 1814 had 10–30% risk of developing R2, R3A or M1.

References

    1. Liew G, Michaelides M, Bunce C. A comparison of the causes of blindness certifications in England and Wales in working age adults (16–64 years), 1999–2000 with 2009–2010. BMJ Open 2014;4:e004015 10.1136/bmjopen-2013-004015 - DOI - PMC - PubMed
    1. Stefánsson E, Bek T, Porta M, et al. . Screening and prevention of diabetic blindness. Acta Ophthalmol Scand 2000;78:374–85. Review 10.1034/j.1600-0420.2000.078004374.x - DOI - PubMed
    1. Kristinsson JK, Gudmundsson JR, Stefánsson E, et al. . Screening for diabetic retinopathy. Initiation and frequency. Acta Ophthalmol Scand 1995;73:525–8. 10.1111/j.1600-0420.1995.tb00329.x - DOI - PubMed
    1. Olafsdóttir E, Stefánsson E. Biennial eye screening in patients with diabetes without retinopathy: 10-year experience. Br J Ophthalmol 2007;91:1599–601. 10.1136/bjo.2007.123810 - DOI - PMC - PubMed
    1. Day TE, Ravi N, Xian H, et al. . Sensitivity of diabetic retinopathy associated vision loss to screening interval in an agent-based/discrete event simulation model. Comput Biol Med 2014;47C:7–12. 10.1016/j.compbiomed.2014.01.007 - DOI - PubMed

Publication types