. 2015 Sep 16;35(37):12673-92.
doi: 10.1523/JNEUROSCI.3651-14.2015.

3D Shape Perception in Posterior Cortical Atrophy: A Visual Neuroscience Perspective

Affiliations

3D Shape Perception in Posterior Cortical Atrophy: A Visual Neuroscience Perspective

Céline R Gillebert et al. J Neurosci. .

Abstract

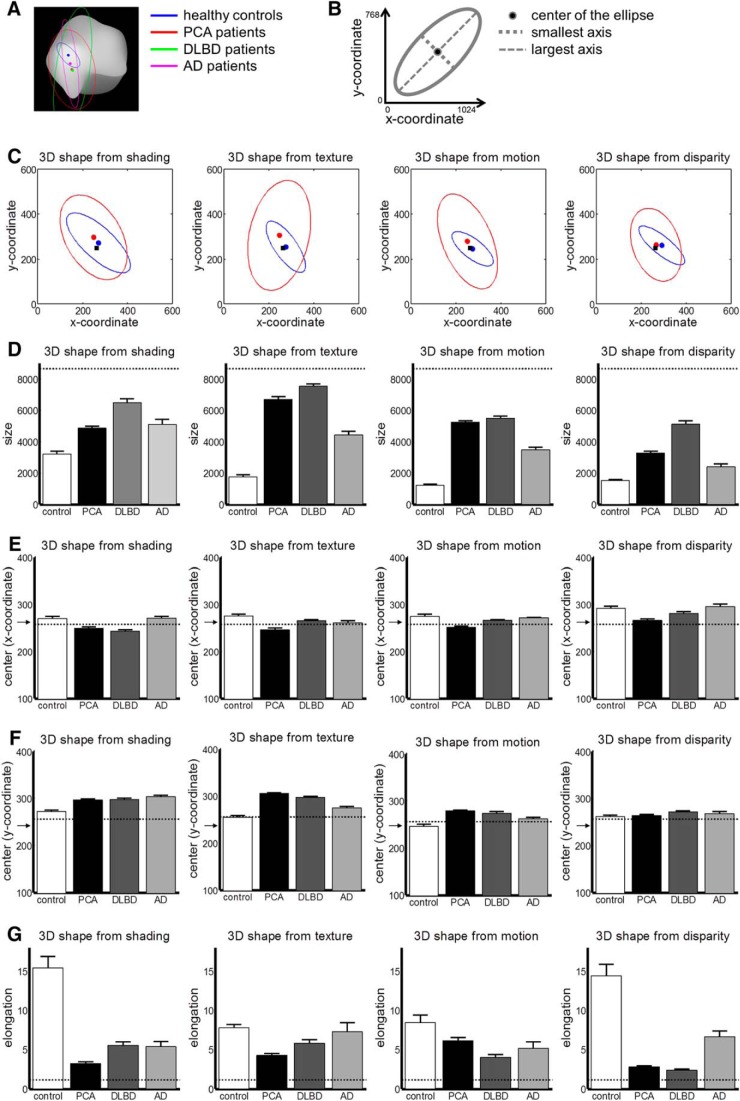
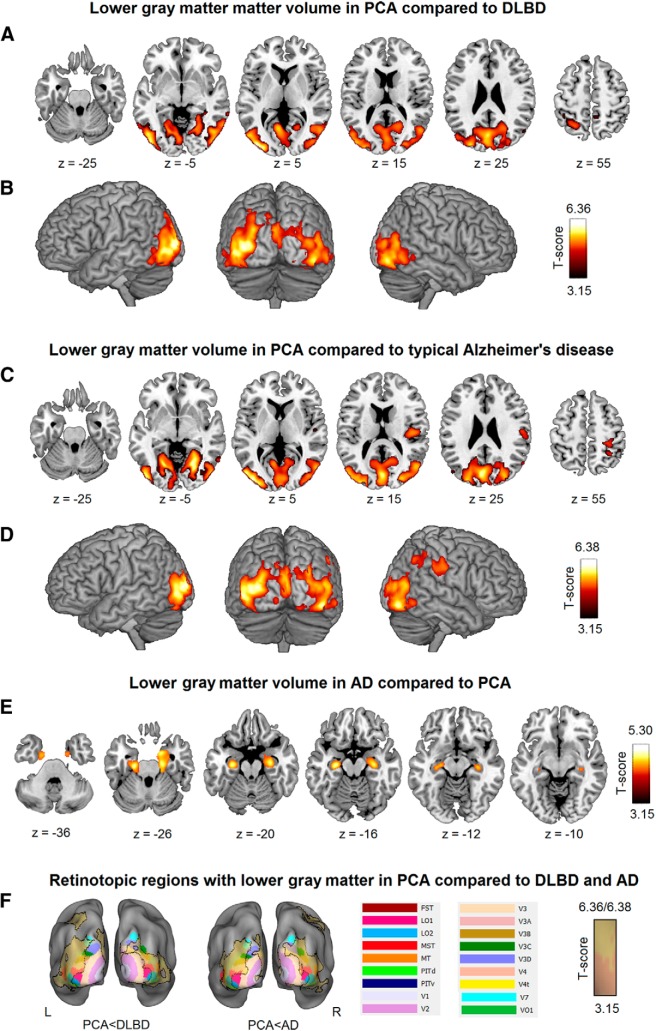
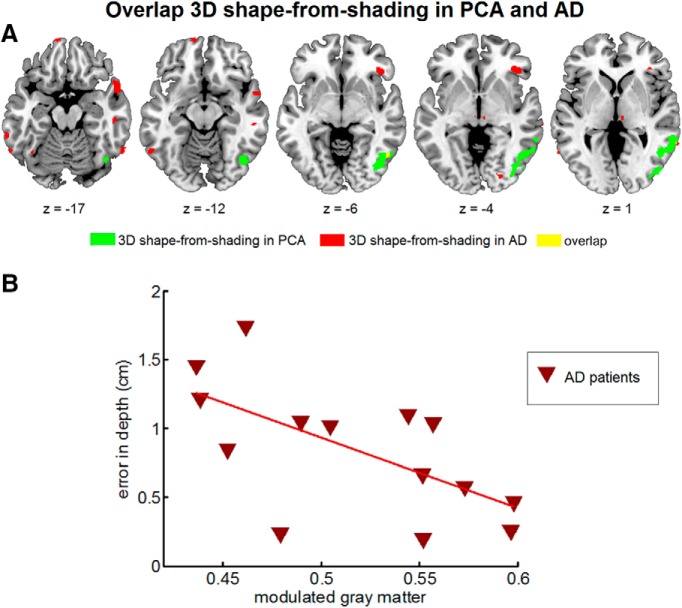
Posterior cortical atrophy (PCA) is a rare focal neurodegenerative syndrome characterized by progressive visuoperceptual and visuospatial deficits, most often due to atypical Alzheimer's disease (AD). We applied insights from basic visual neuroscience to analyze 3D shape perception in humans affected by PCA. Thirteen PCA patients and 30 matched healthy controls participated, together with two patient control groups with diffuse Lewy body dementia (DLBD) and an amnestic-dominant phenotype of AD, respectively. The hierarchical study design consisted of 3D shape processing for 4 cues (shading, motion, texture, and binocular disparity) with corresponding 2D and elementary feature extraction control conditions. PCA and DLBD exhibited severe 3D shape-processing deficits and AD to a lesser degree. In PCA, deficient 3D shape-from-shading was associated with volume loss in the right posterior inferior temporal cortex. This region coincided with a region of functional activation during 3D shape-from-shading in healthy controls. In PCA patients who performed the same fMRI paradigm, response amplitude during 3D shape-from-shading was reduced in this region. Gray matter volume in this region also correlated with 3D shape-from-shading in AD. 3D shape-from-disparity in PCA was associated with volume loss slightly more anteriorly in posterior inferior temporal cortex as well as in ventral premotor cortex. The findings in right posterior inferior temporal cortex and right premotor cortex are consistent with neurophysiologically based models of the functional anatomy of 3D shape processing. However, in DLBD, 3D shape deficits rely on mechanisms distinct from inferior temporal structural integrity.

Significance statement: Posterior cortical atrophy (PCA) is a neurodegenerative syndrome characterized by progressive visuoperceptual dysfunction and most often an atypical presentation of Alzheimer's disease (AD) affecting the ventral and dorsal visual streams rather than the medial temporal system. We applied insights from fundamental visual neuroscience to analyze 3D shape perception in PCA. 3D shape-processing deficits were affected beyond what could be accounted for by lower-order processing deficits. For shading and disparity, this was related to volume loss in regions previously implicated in 3D shape processing in the intact human and nonhuman primate brain. Typical amnestic-dominant AD patients also exhibited 3D shape deficits. Advanced visual neuroscience provides insight into the pathogenesis of PCA that also bears relevance for vision in typical AD.

Keywords: Alzheimer's disease; Lewy body; depth perception; fMRI; voxel-based morphometry.


Figures

Figure 1.
Figure 1.
Visual stimuli. AC, Visual stimuli of the psychophysical experiments. A, Extraction of 3D shape-from-shading, texture, motion, and binocular disparity. B, Examples of the depth maps for three 3D surfaces used in the psychophysical experiment. The color bar reflects the depth difference in centimeters compared with the global maximum of the surface (cutoff at 5.5 cm because depth at the very border is unstable). C, Histogram of the depth differences across all pixels of all 10 3D surfaces. The extreme values (red) correspond to the borders of the surfaces (those exceeding 5.5 cm have been set to 5.5 cm). D, Extraction of 2D shape with the neighboring bars of the grating differing in luminance, texture, motion, or disparity. E, Extraction of features with two squares differing in luminance, texture, motion, or disparity.
Figure 2.
Figure 2.
Primary outcome analysis based on error-in-depth. Behavioral performance for healthy control participants (white), PCA patients (black), DLBD patients (dark gray), and typical AD patients (light gray) for shading, texture, motion, and binocular disparity. Behavioral performance is expressed as the depth component of the difference between the global maximum indicated by the observer and the true global maximum (error-in-depth). Smaller values on this measure reflect better performance. The dotted line indicates the average value on this measure based on 1000 responses randomly distributed across the interior zone of each 3D surface. The dashed line reflects the average error-in-depth obtained when a random spatial error is added to the control data to simulate motor deficits that may be present in PCA patients. Error bars indicate 1 SEM across participants. The circles indicate the individual data points.
Figure 3.
Figure 3.
Analysis based of the in-plane distribution of responses. A, Example of a 95% covariance ellipse for healthy controls (blue), PCA patients (red), DLBD patients (green), and AD patients (magenta) superimposed on the depth map of a 3D shape-from-shading surface. B, Illustration of the ellipse parameters. C, Average ellipses for PCA patients (red) and healthy controls (blue) for the four cues, with red and blue squares indicating average ellipse centers and black square average true global maxima. DG, Parameters of the covariance ellipses (averaged over the 10 3D surfaces) encompassing 95% of the global maxima indicated by healthy controls (white), PCA patients (black), DLBD patients (dark gray), and AD patients (light gray) for shading, texture, motion, and binocular disparity. C, Size (average of the largest and the smallest eigenvalue), D, x-coordinate of the ellipse center (in pixel coordinates, a pixel corresponding to 2.55 min of arc). The arrow indicates the coordinate of the true global maximum. E, y-coordinate of the center (in pixel coordinates). The arrow indicates the coordinate of the true global maximum. F, Elongation (largest eigenvalue divided by smallest eigenvalue). The dotted line indicates the average value on this measure based on 1000 responses randomly distributed across the interior zone of each 3D surface. Error bars indicate 1 SEM across participants.
Figure 4.
Figure 4.
Visuoperceptual deficits on the control tasks. A, B, Extraction of 2D shape. A, Behavioral performance is expressed as the logarithmic Michaelson contrast between neighboring bars of the gratings to achieve an average performance of 82%. Negative values indicate that the Michaelson contrast is between 0% and 100%; positive values indicate that the QUEST algorithm estimates the values to be larger than 100%. B, The group-averaged plot of the values obtained during the course of the 60 trials of the staircase procedure. CD, Feature extraction. C, Behavioral performance expressed as the logarithmic Michaelson between two squares needed to achieve an average performance of 82%. D, Group-averaged plot of the values obtained during the course of the 60 trials of the staircase procedure. Plots for the staircase procedure: blue, healthy controls; red, PCA patients; green, DLBD patients; magenta, AD patients. Shaded areas reflect SEM.
Figure 5.
Figure 5.
Gray matter volume loss in PCA (AC), DLBD (D, E), and typical AD (F, G) versus healthy controls. The t maps indicate the significant reductions of gray matter volume in the different patient groups compared with healthy controls, corrected for age, sex, and scanner effect. All maps are thresholded at cluster-level FWE-corrected p < 0.05 for a voxel-level threshold of p < 0.001 uncorrected. AC, Lower gray matter volume in PCA than in healthy control group. The t-map is projected onto axial (A) and coronal (B) slices of a T1-weighted image template available in MRIcron. C, Rendering on the lateral surfaces of the brain. D, E, Lower gray matter volume is seen in DLBD patients compared with the healthy control group. Shown are axial slices (D) and rendering (E) on the lateral surfaces of the brain. F, G, Lower gray matter volume is seen in AD patients compared with the healthy control group. Shown are axial slices (F) and rendering (G) on the lateral surfaces of the brain. The white arrow indicates hippocampal atrophy in AD.
Figure 6.
Figure 6.
Gray matter volume loss in PCA versus patient control groups. The t maps indicate the significant differences between patient groups, corrected for age, sex, and scanner effect. All maps are thresholded at cluster-level FWE-corrected p < 0.05 for a voxel-level threshold of p < 0.001 uncorrected. A, B, Lower gray matter volume can be seen in PCA patients compared with the DLBD group. Shown are axial slices (A) and rendering (B) on the lateral surfaces of the brain. C, D, Lower gray matter volume can be seen in PCA patients compared with the AD group. Shown are axial slices (C) and rendering (D) on the lateral surfaces of the brain. E, Lower gray matter volume can be seen in AD patients compared with the PCA group (axial slices). F, T-maps for the contrasts of PCA minus DLBD and PCA minus AD are overlaid onto a probabilistic retinotopic map, indicating the differential volume loss in extrastriate course in PCA compared with the two patient control groups.
Figure 7.
Figure 7.
Correlation between gray matter volume loss in PCA and 3D shape-from-shading. A, Voxel-based correlation of gray matter volume with performance of PCA patients on the 3D shape-from-shading task (voxel-level uncorrected p < 0.005; cluster-level FWE-corrected p < 0.05). B, Scatterplot of mean gray matter volume in the inferior temporal cluster and performance on the 3D shape-from-shading task illustrating the distribution of data points obtained in this region with the volumetric regression analysis. Red squares, PCA patients (case numbers correspond to those used in Table 1); red line, regression line obtained in PCA patients. C, Probabilistic retinotopic map (Abdollahi et al., 2014) and 3D shape-from-shading cluster (black line) thresholded at a cluster-level corrected p < 0.05 for an uncorrected voxel-level p < 0.005.
Figure 8.
Figure 8.
Correlation between gray matter volume loss in PCA and 3D shape-from-disparity. A, Voxel-based correlation of gray matter volume with performance of PCA patients on the 3D shape-from-disparity task (voxel-level uncorrected p < 0.005; cluster-level FWE-corrected p < 0.05). B, Scatterplot of mean gray matter volume in the inferior temporal cluster and performance on the 3D shape-from-disparity task. C, Scatterplot of mean gray matter volume in the right premotor cluster and performance on the 3D shape-from-disparity task. Red squares, PCA patients; red lines, regression lines obtained in PCA patients.
Figure 9.
Figure 9.
A, Overlap between the cluster shown in Figure 7A and the cluster shown in Figure 8A. B, Overlap between the cluster shown in Figure 7A and the map of the correlation between volume and 2D orientation discrimination. Green, Cluster where gray matter volume correlates with 3D shape-from-shading (voxel-level uncorrected p < 0.005 and cluster-level FWE-corrected p < 0.05); red, map of correlation of gray matter volume with 3D shape-from-disparity (A) and 2D-from-shading (B) in PCA patients (voxel-level uncorrected p < 0.005); yellow, overlap.
Figure 10.
Figure 10.
Overlap between the cluster shown in Figure 7A obtained in PCA patients for 3D shape-from-shading and a map of the correlation between volume and 3D shape-from-shading in AD patients. A, Green, Cluster where gray matter volume correlates with 3D shape-from-shading (voxel-level uncorrected p < 0.001 and cluster-level FWE-corrected p < 0.05); red, map of correlation of gray matter volume with 3D shape-from-disparity in AD (voxel-level uncorrected p < 0.01; without cluster-level FWE-correction); yellow, overlap. B, Scatterplot of mean gray matter volume obtained in the region shown in A and performance on the 3D shape-from-disparity in AD patients. Red triangles, AD patients; red line, regression line obtained in AD patients (r = −0.626).
Figure 11.
Figure 11.
Task-related fMRI: 3D shape-from-shading network. A, Visual stimuli of the fMRI experiment. Shading stimuli: 3D shaded stimuli and two control conditions: 2D shaded-blob and 2D pixel-scrambled stimuli. B, t-map for the extraction of 3D shape-from-shading [conjunction of contrast 1 (3D shape-from-shading minus 2D shaded-blobs) and contrast 2 (3D shape-from-shading minus 2D pixel-scrambled)]. Random-effects analysis (fMRI) in 18 healthy controls, threshold: voxel-level uncorrected p < 0.001, cluster-level FWE-corrected p < 0.05. The t-map is projected onto a surface rendering of the brain (Van Essen, 2005). The black outlines reflect the regions found by Georgieva et al. (2008) in healthy young volunteers using the same contrast. C, Superposition between the fMRI activity cluster during passive viewing of 3D shape-from-shading minus control in healthy controls (red) and the cluster where gray matter volume correlates with 3D shape-from-shading scores in PCA (green). Overlap is indicated in yellow. D, E, Mean percentage signal change (relative to the fixation condition) for 3D shading stimuli, 2D pixel-scrambled stimuli, and 2D shaded-blobs in healthy controls and 5 PCA patients in left ITG (D) and right ITG (E). Error bars indicate SEM.

Similar articles

Cited by

References

    1. Abdollahi RO, Kolster H, Glasser MF, Robinson EC, Coalson TS, Dierker D, Jenkinson M, Van Essen DC, Orban GA. Correspondences between retinotopic areas and myelin maps in human visual cortex. Neuroimage. 2014;99:509–524. doi: 10.1016/j.neuroimage.2014.06.042. - DOI - PMC - PubMed
    1. Ashburner J, Friston KJ. Unified segmentation. Neuroimage. 2005;26:839–851. doi: 10.1016/j.neuroimage.2005.02.018. - DOI - PubMed
    1. Benson DF, Davis RJ, Snyder BD. Posterior cortical atrophy. Arch Neurol. 1988;45:789–793. doi: 10.1001/archneur.1988.00520310107024. - DOI - PubMed
    1. Berthier ML, Leiguarda R, Starkstein SE, Sevlever G, Taratuto AL. Alzheimer's disease in a patient with posterior cortical atrophy. J Neurol Neurosurg Psychiatry. 1991;54:1110–1111. doi: 10.1136/jnnp.54.12.1110. - DOI - PMC - PubMed
    1. Bohr I, Read JC. Stereoacuity with frisby and revised fd2 stereo tests. PLoS One. 2013;8:e82999. doi: 10.1371/journal.pone.0082999. - DOI - PMC - PubMed

Publication types

MeSH terms