. 2015 Sep 16;35(37):12792-812.
doi: 10.1523/JNEUROSCI.1638-15.2015.

Identified Serotonin-Releasing Neurons Induce Behavioral Quiescence and Suppress Mating in Drosophila

Affiliations

Identified Serotonin-Releasing Neurons Induce Behavioral Quiescence and Suppress Mating in Drosophila

Atefeh Pooryasin et al. J Neurosci. .

Abstract

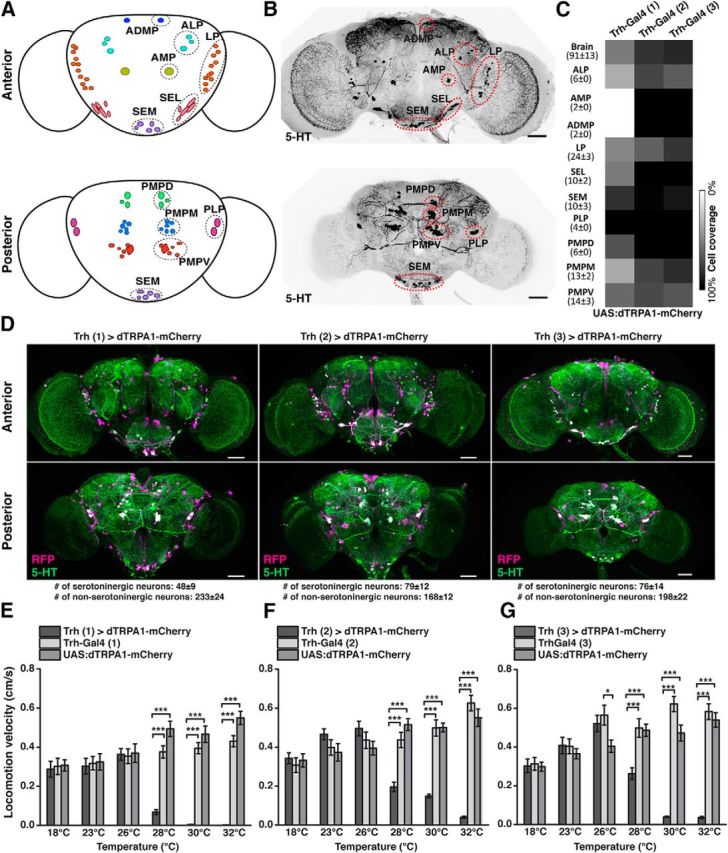
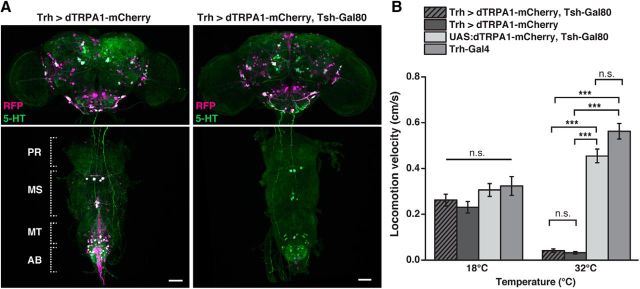
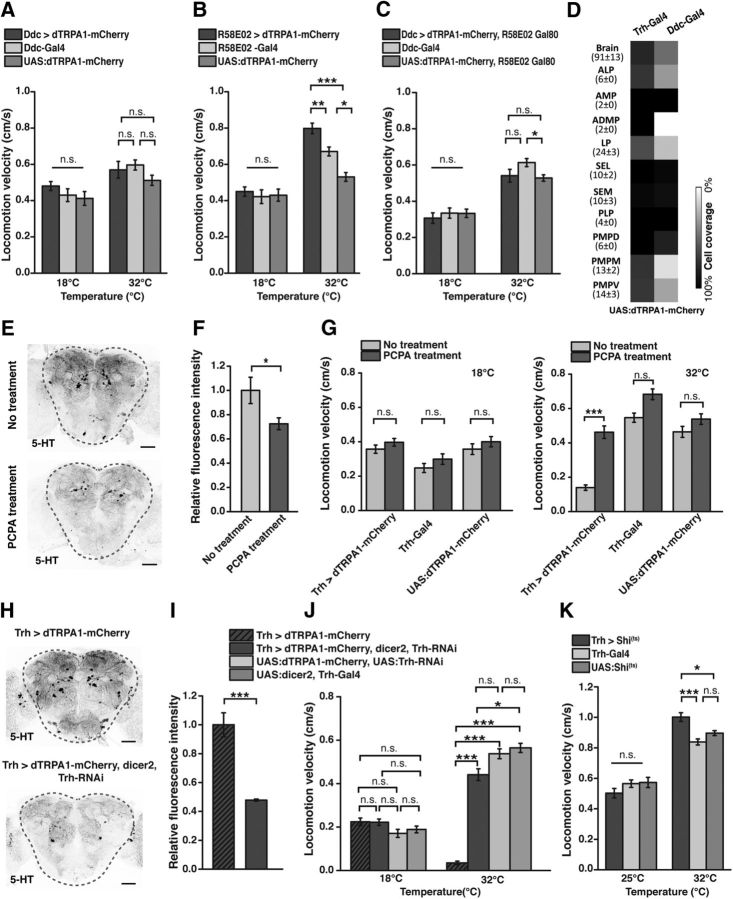
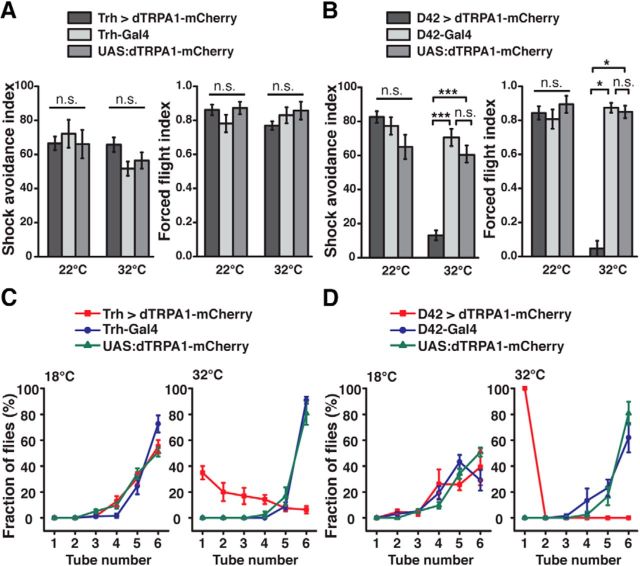
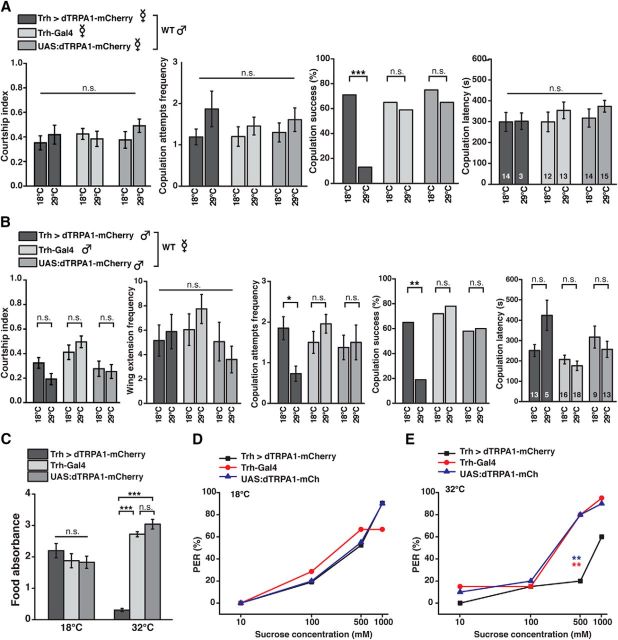
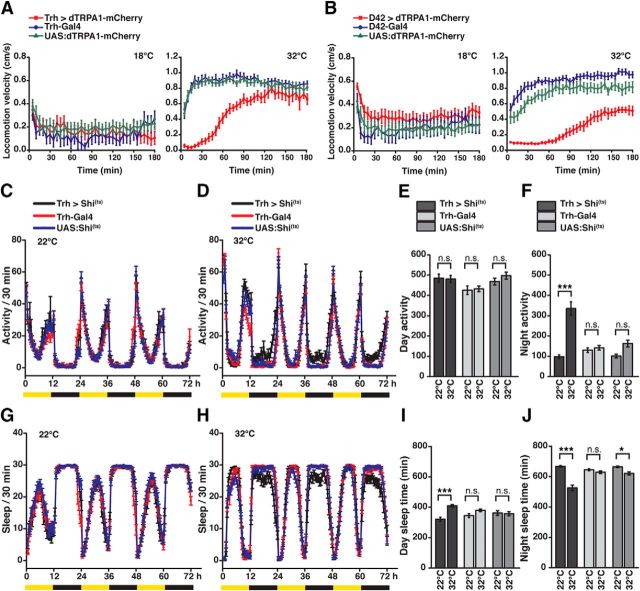
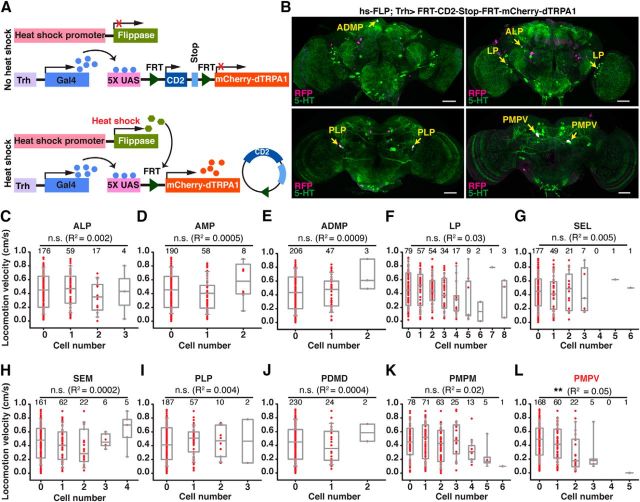
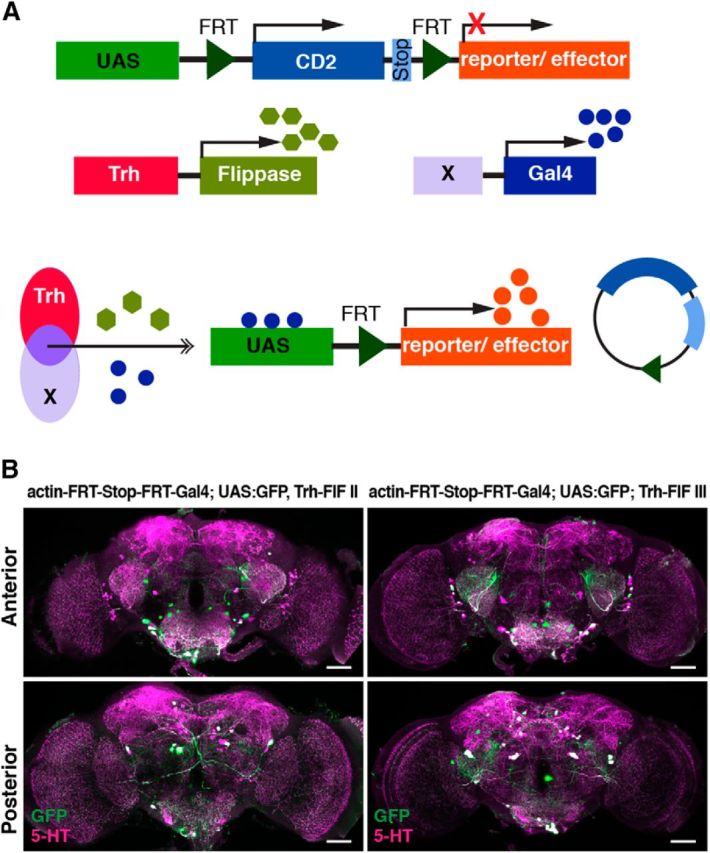
Animals show different levels of activity that are reflected in sensory responsiveness and endogenously generated behaviors. Biogenic amines have been determined to be causal factors for these states of arousal. It is well established that, in Drosophila, dopamine and octopamine promote increased arousal. However, little is known about factors that regulate arousal negatively and induce states of quiescence. Moreover, it remains unclear whether global, diffuse modulatory systems comprehensively affecting brain activity determine general states of arousal. Alternatively, individual aminergic neurons might selectively modulate the animals' activity in a distinct behavioral context. Here, we show that artificially activating large populations of serotonin-releasing neurons induces behavioral quiescence and inhibits feeding and mating. We systematically narrowed down a role of serotonin in inhibiting endogenously generated locomotor activity to neurons located in the posterior medial protocerebrum. We identified neurons of this cell cluster that suppress mating, but not feeding behavior. These results suggest that serotonin does not uniformly act as global, negative modulator of general arousal. Rather, distinct serotoninergic neurons can act as inhibitory modulators of specific behaviors.

Significance statement: An animal's responsiveness to external stimuli and its various types of endogenously generated, motivated behavior are highly dynamic and change between states of high activity and states of low activity. It remains unclear whether these states are mediated by unitary modulatory systems globally affecting brain activity, or whether distinct neurons modulate specific neuronal circuits underlying particular types of behavior. Using the model organism Drosophila melanogaster, we find that activating large proportions of serotonin-releasing neurons induces behavioral quiescence. Moreover, distinct serotonin-releasing neurons that we genetically isolated and identified negatively affect aspects of mating behavior, but not food uptake. This demonstrates that individual serotoninergic neurons can modulate distinct types of behavior selectively.

Keywords: Drosophila; arousal; motivational behavior; neuronal circuits; serotonin; thermogenetics.


Figures

Figure 1.
Figure 1.
Thermogenetic activation of Trh-Gal4-positive neurons induces behavioral quiescence. A, Schematic illustration of 5-HT neuron clusters in the central brain. B, 5-HT-immunoreactive neurons in the brain. C, Coverage of 5-HT neurons by three different Trh-Gal4 strains. Numbers in parentheses indicate the total numbers of 5-HT-immunoreactive neurons for each cluster in both central brain hemispheres (mean ± SD, n = 18). Grayscale represents the relative coverage of these neurons by the three Trh-Gal4 lines when UAS:dTRPA1-mCherry is used as a reporter (n = 3 brains each). D, Expression of dTRPA1-mCherry under control of the three Trh-Gal4 lines. Magenta represents anti-RFP immunostaining against dTRPA1-mCherry. Green represents anti-5-HT immunostaining. White represents the overlap. Images represent maximal intensity z-axis projections across stacks of confocal images. The numbers of somata are indicated below the panels (mean ± SD, n = 3 brains). E–G, Temperature-dependent decrease in locomotion velocity in flies expressing dTRPA1-mCherry under control of the three Trh-Gal4 lines compared with the heterozygous Trh-Gal4 lines and the heterozygous UAS:dTRPA1-mCherry line. Bars indicate mean ± SEM (n = 27 each). *p < 0.05. ***p < 0.001. For exact statistical values, see Table 3. Scale bars, 50 μm.
Figure 2.
Figure 2.
Behavioral quiescence is induced by 5-HT neurons in the brain. A, Expression of dTRPA1-mCherry under control of Trh-Gal4 in the brain, the thoracic, and the abdominal ganglia (left). Gene expression is restricted to brain neurons using Tsh-Gal80 (right). Magenta represents anti-RFP immunoreactivity against dTRPA1-mCherry. Green represents anti-5-HT immunoreactivity. White represents the overlap. AB, Abdominal ganglia; MS, mesothoracic ganglia; MT, metathoracic ganglia; PR, prothoracic ganglia. Scale bars, 50 μm. B, Thermogenetic activation of all Trh-Gal4-positive neurons and of Trh-Gal4-positive neurons in the brain only equally decreases locomotor activity. Bars indicate mean ± SEM (n = 27–28). n.s., Not significant (p > 0.05). ***p < 0.001.
Figure 3.
Figure 3.
Behavioral quiescence is induced by serotonin. A, Thermogenetic activation of Ddc-Gal4-positive neurons does not induce any change in locomotor activity (n = 36 or 37). B, Thermogenetic activation of R58E02-Gal4-positive neurons induces higher locomotor activity (n = 35–37). C, Thermogenetic activation of Ddc-Gal4-positive neurons, but excluding dopaminergic neurons of the PAM cluster using R58E02-Gal80, does not induce any change in locomotor activity (n = 34–36). D, Coverage of 5-HT neurons by Ddc-Gal4 compared with Trh-Gal4. Numbers in parentheses indicate the total numbers of 5-HT-immunoreactive neurons for each cluster in both central brain hemispheres (mean ± SD, n = 18). Grayscale represents the relative coverage of these neurons by the two Gal4 lines when UAS:dTRPA1-mCherry is used as a reporter (n = 3 brains each). E, Feeding of PCPA reduces 5-HT immunoreactivity. Dashed lines indicate the region within the central brain used for quantification shown in F. Scale bar, 50 μm. F, PCPA partially reduces 5-HT levels (n = 5). G, The decrease in locomotion velocity induced by thermogenetic activation of Trh-Gal4-positive neurons is extenuated by PCPA feeding (n = 33–39). H, Downregulation of serotonin synthesis using Trh-RNAi leads to a reduction in 5-HT immunoreactivity. Dashed lines indicate the regions within the central brain used for quantification shown in I. Scale bar, 50 μm. I, Intensity of anti-5-HT immunoreactivity. Downregulation of tryptophan hydroxylase using Trh-RNAi reduces 5-HT levels (n = 4). J, The decrease in locomotion velocity induced by thermogenetic activation of Trh-Gal4-positive neurons is extenuated by Trh-RNAi expression (n = 37–45). K, Blocking synaptic transmitter release from Trh-Gal4-positive neurons using UAS:shi(ts) causes an increase in locomotor activity (n = 35–41). Bars indicate mean ± SEM. n.s., Not significant (p > 0.05). *p < 0.05. **p < 0.01. ***p < 0.001.
Figure 4.
Figure 4.
Thermogenetic activation of 5-HT neurons does not affect locomotor abilities. A, Electric shock avoidance (left panel, n = 10 or 11) and forced flight (right panel, n = 5) are unaffected in flies expressing dTRPA1-mCherry under control of Trh-Gal4, both at 22°C and 32°C, compared with the heterozygous parental strains. B, In flies expressing dTRPA1-mCherry in motor neurons under control of D42-Gal4, thermogenetic neuronal activation impairs electric shock avoidance (left panel, n = 10 or 11) and forced flight (right panel, n = 5) at the effective temperature of 32°C, but not at 22°C. C, Negative geotaxis behavior assayed by countercurrent distribution at 18°C (left) and 32°C (right) in flies expressing dTRPA1-mCherry under control of Trh-Gal4 compared with the heterozygous parental strains. At 18°C, no difference between the strains is observed. At 32°C, negative geotaxis is attenuated, but not abolished, in flies expressing dTRPA1-mCherry under control of Trh-Gal4 (n = 5). D, Negative geotaxis behavior of flies expressing dTRPA1-mCherry under control of D42-Gal4 is indistinguishable from the heterozygous parental lines at 18°C (left). At 32°C (right), negative geotaxis is completely abolished in flies expressing dTRPA1-mCherry under control of D42-Gal4 (n = 5). Data points and bars indicate mean ± SEM. n.s., Not significant (p > 0.05). *p < 0.05. ***p < 0.001.
Figure 5.
Figure 5.
5-HT neurons reduce motivated behaviors and sensory responsiveness. A, Mating behavior of wild-type males toward virgin females expressing dTRPA1-mCherry under Trh-Gal4 control or toward genetic control strains was quantified at 18°C and 29°C. For neither female genotype, male courtship index, frequency of male copulation attempts, or copulation latency of those males that succeeded to copulate (n indicated within the bars) was significantly different between 18°C and 29°C. Copulation success (female receptivity) was significantly reduced due to thermogenetic activation of Trh-Gal4-positive neurons. n = 20–23. B, Mating behavior of males expressing dTRPA1-mCherry under Trh-Gal4 control or of genetic control strains toward wild-type virgin females was quantified at 18°C and 29°C. Thermogenetic activation of Trh-Gal4-positive neurons in males did not significantly reduce courtship index or wing extension frequency, but copulation attempts frequency and copulation success (n = 16–23). Those males that succeeded to copulate showed no statistically significant difference at the given sample size (n indicated within the bars). C, Food uptake is significantly reduced in starved flies expressing dTRPA1-mCherry under control of Trh-Gal4 at 32°C, but not at 18°C (n = 5). D, E, Sucrose-induced proboscis extension reflex (PER) was quantified at 18°C (D) and 32°C (E) in flies expressing dTRPA1-mCherry under control of Trh-Gal4 and in genetic control strains. Thermoactivation of 5-HT neurons shifts gustatory responsiveness toward higher sucrose concentrations (n = 20 or 21). Bars and data points indicate means; error bars indicate SEM. n.s., Not significant (p > 0.05). *p < 0.05. **p < 0.01. ***p < 0.001.
Figure 6.
Figure 6.
Blocking synaptic output from 5-HT neurons affects circadian activity and sleep. A, The locomotion velocity of the flies expressing dTRPA1-mCherry under Trh-Gal4 control and the heterozygous parental lines were monitored for 3 h at 18°C and 32°C. Locomotion velocity over a 3 h time course was indistinguishable among all groups at 18°C. At 32°C, initial locomotion velocity of flies expressing dTRPA1-mCherry under Trh-Gal4 control was reduced compared with the parental controls. However, after ∼45 min, the Trh > dTRPA1-mCherry flies recovered from quiescence and locomotion velocity returned to baseline after ∼120 min. B, The locomotion velocity of the flies expressing dTRPA1-mCherry under D42-Gal4 control and the heterozygous parental lines were monitored for 3 h at 18°C and 32°C. Locomotion velocity over a 3 h course time was indistinguishable among all groups at 18°C. At 32°C, flies expressing dTRPA1-mCherry under D42-Gal4 control paralyzed. However, after ∼70 min, the D42 > dTRPA1-mCherry flies recovered from paralysis and locomotion increased. Dots indicate mean ± SEM for 5 min time bins (n = 8 or 9). C–F, Circadian locomotion activity over 72 h at light-dark cycles indicated by yellow/black bars compared between flies expressing shi(ts) under control of Trh-Gal4 and genetic controls at the permissive temperature of 22°C (C) and the restrictive temperature of 32°C (D). Quantification of total day (E) and night activity (F) at 22°C and 32°C. G–J, Sleep time per 30 min during 72 h, indicated by yellow/black bars (mean ± SEM), at the permissive temperature of 22°C (G) and the restrictive temperature of 32°C (H). Quantification of total sleep time during day time (I) and night time (J). n = 42 or 43. Data points in line diagrams indicate mean ± SEM in 30 min time bins; bars indicate means ± SEM. n.s., Not significant (p > 0.05). *p < 0.05. ***p < 0.001.
Figure 7.
Figure 7.
Stochastic activation of subsets of 5-HT neurons indicates a role of PMPV neurons for inducing behavioral quiescence. A, Schematic illustration of stochastically expressing mCherry-dTRPA1 in random subsets of Trh-Gal4-positive neurons using a UAS:FRT-CD2-stop-FRT-mCherry-dTRPA1 line and a flippase (FLP) under heat-shock promoter control. B, Representative examples for stochastic expression of mCherry-dTRPA1 in subsets of 5-HT neurons. Magenta represents anti-RFP immunoreactivity against mCherry-dTRPA1. Green represents anti-5-HT immunoreactivity. White represents the overlap. Yellow arrows indicate 5-HT neurons expressing mCherry-dTRPA1. Scale bars, 50 μm. C–L, Effect of the number of activated 5-HT neurons in specific clusters on locomotion velocity. The dataset for each panel is obtained from 256 flies expressing mCherry-dTRPA1 stochastically in different subsets of neurons. The cluster names are indicated above the respective panels. Red dots indicate the locomotion velocity for individual flies expressing mCherry-dTRPA1 in the indicated number of neurons. Box plots (gray) represent medians and interquartile ranges. Whiskers represent 10/90 percentiles for each group of flies with distinct numbers of thermoactivated 5-HT neurons in a defined cluster. Regression analysis (R2 values indicated) revealed only for the PMPV cluster (L) a significant difference in locomotion velocity among flies expressing mCherry-dTRPA1 in different numbers of neurons. No significant difference was observed for all other neuron clusters. n.s., Not significant (p > 0.05). **p < 0.01.
Figure 8.
Figure 8.
Restriction of gene expression to 5-HT neurons using flippase under control of a Trh promoter sequence. A, Schematic illustration of the intersectional gene expression of transgenes in defined subsets of 5-HT neurons usingUAS:FRT-CD2-stop-FRT-reporter/effector, Trh-flippase, and diverse (X) Gal4 lines. B, Immunohistochemical stainings of brains are shown across stacks of confocal images as z-axis projections of maximal fluorescence intensity from anterior (top row) or posterior view (bottom row). GFP expression (green) is driven in those neurons in which a stop codon is removed through flippase (FIF) expression under control of a Trh promoter. Magenta represents anti-5-HT immunoreactivity. Left side represents Trh-FIF insertion on the second chromosome. Right side represents Trh-FIF insertion on the third chromosome. GFP expression is driven predominantly in a large proportion of 5-HT-positive neurons. Scale bars, 50 μm.
Figure 9.
Figure 9.
Restriction of gene expression to confined 5-HT neurons using intersectional genetics. Expression of mCD8:GFP (anti-GFP immunoreactivity) in the brain under control of different Gal4 driver lines using the UAS-Gal4 system (left column) and restriction of mCD8:GFP expression to defined 5-HT neurons (middle and right columns). Middle column represents anti-GFP immunostainings. Right column represents the overlap of anti-GFP staining (green) and anti-5-HT immunoreactivity (magenta). The identities and positions of 5-HT neuron clusters expressing mCD8:GFP are indicated by red arrows and dashed circles. Scale bars, 50 μm.
Figure 10.
Figure 10.
Thermogenetic activation of 5-HT neurons of the PMPV cluster induces behavioral quiescence. A, Expression of mCherry-dTRPA1 (anti-RFP immunoreactivity, magenta) in the brain under control different Gal4 driver lines (rows) is restricted to defined 5-HT neurons through a flippase (FIF) under control of a Trh-promoter sequence. Left column represents maximal intensity projections across stacks of confocal images from an anterior view on the brain. Right column represents a posterior view. Green represents anti-5-HT immunoreactivity. White represents the overlap. Yellow circles and arrows indicate identified 5-HT neuron clusters. Scale bars, 50 μm. B, C, Flies expressing mCherry-dTRPA1 in distinct subsets of 5-HT neurons and the respective parental controls were tested for locomotion velocity at 18°C (B) and 32°C (C) (n = 26–32). Bars indicate mean ± SEM. n.s., Not significant (p > 0.05). ***p < 0.001.
Figure 11.
Figure 11.
Anatomical description of PMPV neurons. Dense arborizations of PMPV cluster neurons were visualized by differential fluorescence reporter expression using UAS:Flybow 2.0/m-hs-FLP; R66A09-Gal4/Trh-FIF. Random expression of GFP and mCitrine in 5-HT neurons covered by R66A09-Gal4 allows for distinguishing the arborizations of two neurons, PMPV1 (A) and PMPV2 (B). Left images represent GFP (green), mCitrine (yellow) expression and anti-DLG immunoreactivity (blue). The center images show GFP and mCitrine expression overlapping with anti-5-HT immunoreactivity (red). 3D reconstructions of the two neurons are shown on the right, without (top) and with anti-DLG staining (bottom). Scale bars, 50 μm.
Figure 12.
Figure 12.
Thermogenetic activation of PMPV neurons affects mating behavior. A, Mating behavior of wild-type males toward virgin females expressing mCherry-dTRPA1 in 5-HT neurons of the PMPV cluster covered by R66A09-Gal4, R67B05-Gal4, or genetic control strains at 18°C and 29°C. For neither female genotype male courtship behavior or the frequency of copulation attempts was significantly different between 18°C and 29°C. However, copulation success (female receptivity) was significantly reduced due to thermogenetic activation of PMPV neurons. n = 29–32. Those males that succeeded to copulate showed unaltered copulation latency (n indicated within the bars). B, Mating behavior of males expressing mCherry-dTRPA1 in PMPV neurons covered by R66A09-Gal4, R67B05-Gal4, or genetic control strains toward wild-type virgin females at 18°C and 29°C. Thermogenetic activation of PMPV neurons in males significantly reduced overall courtship behavior, but not wing extension frequency. The frequency of copulation attempts and copulation success was significantly reduced (n = 30–33). Those males that succeeded to mate showed unaltered copulation latency (n indicated within the bars). Bars indicate means; error bars indicate SEM. n.s., Not significant (p > 0.05). *p < 0.05. **p < 0.01. ***p < 0.001.
Figure 13.
Figure 13.
Food uptake is not affected by thermogenetic activation of PMPV neurons. A, B, Food uptake is not significantly reduced in starved flies expressing mCherry-dTRPA1 in PMPV neurons at 18°C (A) or 32°C (B) (n = 7 or 8). Bars indicate means; error bars indicate SEM. n.s., Not significant (p > 0.05).

References

    1. Alekseyenko OV, Lee C, Kravitz EA. Targeted manipulation of serotonergic neurotransmission affects the escalation of aggression in adult male Drosophila melanogaster. PLoS One. 2010;5:e10806. doi: 10.1371/journal.pone.0010806. - DOI - PMC - PubMed
    1. Alekseyenko OV, Chan YB, Fernandez Mde L, Bülow T, Pankratz MJ, Kravitz EA. Single serotonergic neurons that modulate aggression in Drosophila. Curr Biol. 2014;24:2700–2707. doi: 10.1016/j.cub.2014.09.051. - DOI - PMC - PubMed
    1. Andretic R, van Swinderen B, Greenspan RJ. Dopaminergic modulation of arousal in Drosophila. Curr Biol. 2005;15:1165–1175. doi: 10.1016/j.cub.2005.05.025. - DOI - PubMed
    1. Andrew RJ. Arousal and the causation of behaviour. Behaviour. 1974;51:135–165. doi: 10.1163/156853974X00174. - DOI - PubMed
    1. Aso Y, Hattori D, Yu Y, Johnston RM, Iyer NA, Ngo TT, Dionne H, Abbott LF, Axel R, Tanimoto H, Rubin GM. The neuronal architecture of the mushroom body provides a logic for associative learning. ELife. 2014;3:e04577. doi: 10.7554/eLife.04577. - DOI - PMC - PubMed

Publication types

MeSH terms

LinkOut - more resources