Intrinsic Functional Connectivity Patterns Predict Consciousness Level and Recovery Outcome in Acquired Brain Injury
- PMID: 26377477
- PMCID: PMC4571611
- DOI: 10.1523/JNEUROSCI.0415-15.2015
Intrinsic Functional Connectivity Patterns Predict Consciousness Level and Recovery Outcome in Acquired Brain Injury
Abstract
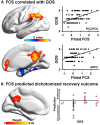
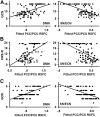
For accurate diagnosis and prognostic prediction of acquired brain injury (ABI), it is crucial to understand the neurobiological mechanisms underlying loss of consciousness. However, there is no consensus on which regions and networks act as biomarkers for consciousness level and recovery outcome in ABI. Using resting-state fMRI, we assessed intrinsic functional connectivity strength (FCS) of whole-brain networks in a large sample of 99 ABI patients with varying degrees of consciousness loss (including fully preserved consciousness state, minimally conscious state, unresponsive wakefulness syndrome/vegetative state, and coma) and 34 healthy control subjects. Consciousness level was evaluated using the Glasgow Coma Scale and Coma Recovery Scale-Revised on the day of fMRI scanning; recovery outcome was assessed using the Glasgow Outcome Scale 3 months after the fMRI scanning. One-way ANOVA of FCS, Spearman correlation analyses between FCS and the consciousness level and recovery outcome, and FCS-based multivariate pattern analysis were performed. We found decreased FCS with loss of consciousness primarily distributed in the posterior cingulate cortex/precuneus (PCC/PCU), medial prefrontal cortex, and lateral parietal cortex. The FCS values of these regions were significantly correlated with consciousness level and recovery outcome. Multivariate support vector machine discrimination analysis revealed that the FCS patterns predicted whether patients with unresponsive wakefulness syndrome/vegetative state and coma would regain consciousness with an accuracy of 81.25%, and the most discriminative region was the PCC/PCU. These findings suggest that intrinsic functional connectivity patterns of the human posteromedial cortex could serve as a potential indicator for consciousness level and recovery outcome in individuals with ABI.
Significance statement: Varying degrees of consciousness loss and recovery are commonly observed in acquired brain injury patients, yet the underlying neurobiological mechanisms remain elusive. Using a large sample of patients with varying degrees of consciousness loss, we demonstrate that intrinsic functional connectivity strength in many brain regions, especially in the posterior cingulate cortex and precuneus, significantly correlated with consciousness level and recovery outcome. We further demonstrate that the functional connectivity pattern of these regions can predict patients with unresponsive wakefulness syndrome/vegetative state and coma would regain consciousness with an accuracy of 81.25%. Our study thus provides potentially important biomarkers of acquired brain injury in clinical diagnosis, prediction of recovery outcome, and decision making for treatment strategies for patients with severe loss of consciousness.
Keywords: acquired brain injury; hub; posterior cingulate cortex/precuneus; prediction; recovery outcome; resting state fMRI.
Copyright © 2015 the authors 0270-6474/15/3512933-15$15.00/0.
Figures


Similar articles
-
Disruption of posteromedial large-scale neural communication predicts recovery from coma.Neurology. 2015 Dec 8;85(23):2036-44. doi: 10.1212/WNL.0000000000002196. Epub 2015 Nov 11. Neurology. 2015. PMID: 26561296 Free PMC article. Clinical Trial.
-
Intrinsic functional connectivity differentiates minimally conscious from unresponsive patients.Brain. 2015 Sep;138(Pt 9):2619-31. doi: 10.1093/brain/awv169. Epub 2015 Jun 27. Brain. 2015. PMID: 26117367
-
Functional networks reemerge during recovery of consciousness after acute severe traumatic brain injury.Cortex. 2018 Sep;106:299-308. doi: 10.1016/j.cortex.2018.05.004. Epub 2018 May 12. Cortex. 2018. PMID: 29871771 Free PMC article.
-
Functional neuroanatomy of disorders of consciousness.Epilepsy Behav. 2014 Jan;30:28-32. doi: 10.1016/j.yebeh.2013.09.014. Epub 2013 Oct 5. Epilepsy Behav. 2014. PMID: 24100252 Review.
-
The structural and functional connectivity of the posterior cingulate cortex: comparison between deterministic and probabilistic tractography for the investigation of structure-function relationships.Neuroimage. 2014 Nov 15;102 Pt 1:118-27. doi: 10.1016/j.neuroimage.2013.12.022. Epub 2013 Dec 21. Neuroimage. 2014. PMID: 24365673 Review.
Cited by
-
Family Income Mediates the Effect of Parental Education on Adolescents' Hippocampus Activation During an N-Back Memory Task.Brain Sci. 2020 Aug 5;10(8):520. doi: 10.3390/brainsci10080520. Brain Sci. 2020. PMID: 32764344 Free PMC article.
-
Prognosis of consciousness disorders in the intensive care unit.Presse Med. 2023 Jun;52(2):104180. doi: 10.1016/j.lpm.2023.104180. Epub 2023 Oct 5. Presse Med. 2023. PMID: 37805070 Free PMC article. Review.
-
Functional Evaluation of Awareness in Vegetative and Minimally Conscious State.Open Neuroimag J. 2017 Apr 27;11:17-25. doi: 10.2174/1874440001711010017. eCollection 2017. Open Neuroimag J. 2017. PMID: 28553427 Free PMC article.
-
Perturbational complexity index in assessing responsiveness to rTMS treatment in patients with disorders of consciousness: a cross-over randomized controlled trial study.J Neuroeng Rehabil. 2024 Sep 19;21(1):167. doi: 10.1186/s12984-024-01455-1. J Neuroeng Rehabil. 2024. PMID: 39300529 Free PMC article. Clinical Trial.
-
Thalamic burst and tonic firing selectively indicate patients' consciousness level and recovery.Innovation (Camb). 2025 Feb 25;6(5):100846. doi: 10.1016/j.xinn.2025.100846. eCollection 2025 May 5. Innovation (Camb). 2025. PMID: 40432773 Free PMC article.
References
-
- Boly M, Tshibanda L, Vanhaudenhuyse A, Noirhomme Q, Schnakers C, Ledoux D, Boveroux P, Garweg C, Lambermont B, Phillips C, Luxen A, Moonen G, Bassetti C, Maquet P, Laureys S. Functional connectivity in the default network during resting state is preserved in a vegetative but not in a brain dead patient. Hum Brain Mapp. 2009;30:2393–2400. doi: 10.1002/hbm.20672. - DOI - PMC - PubMed
-
- Buckner RL, Sepulcre J, Talukdar T, Krienen FM, Liu H, Hedden T, Andrews-Hanna JR, Sperling RA, Johnson KA. Cortical hubs revealed by intrinsic functional connectivity: mapping, assessment of stability, and relation to Alzheimer's disease. J Neurosci. 2009;29:1860–1873. doi: 10.1523/JNEUROSCI.5062-08.2009. - DOI - PMC - PubMed
Publication types
MeSH terms
Grants and funding
LinkOut - more resources
Full Text Sources
