

A Neural Basis for Developmental Topographic Disorientation
- PMID: 26377479
- PMCID: PMC4571612
- DOI: 10.1523/JNEUROSCI.0640-15.2015
A Neural Basis for Developmental Topographic Disorientation
Abstract
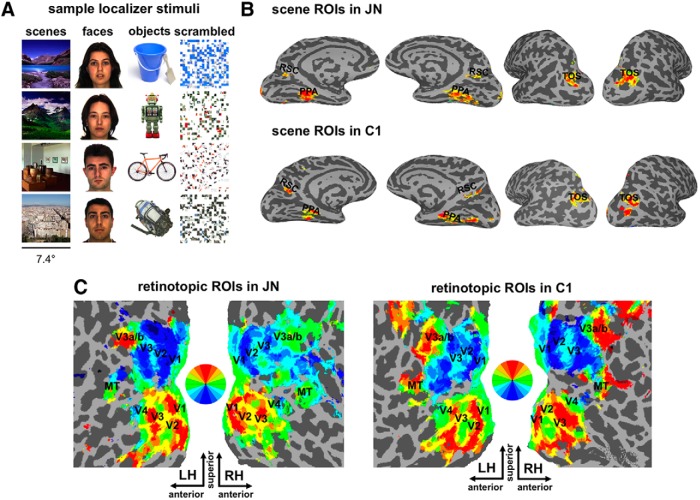
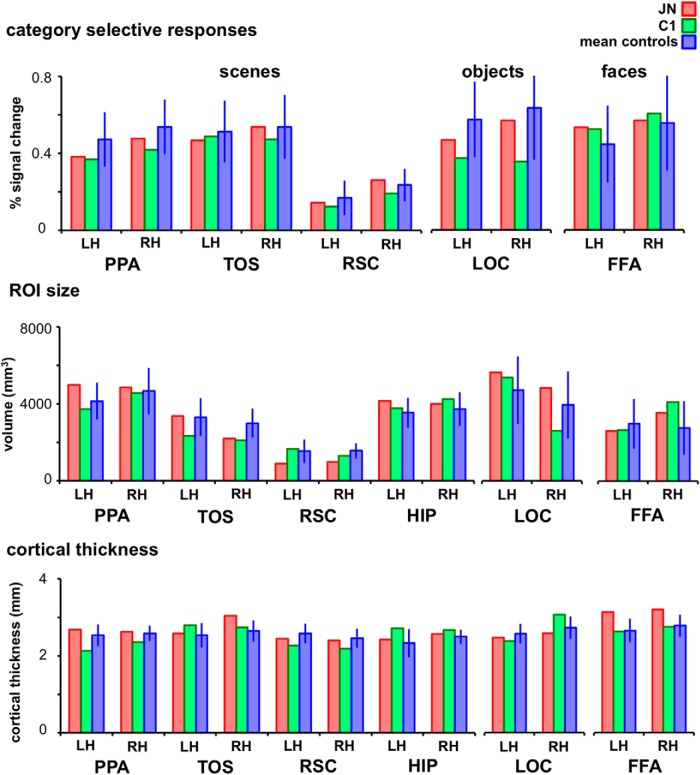
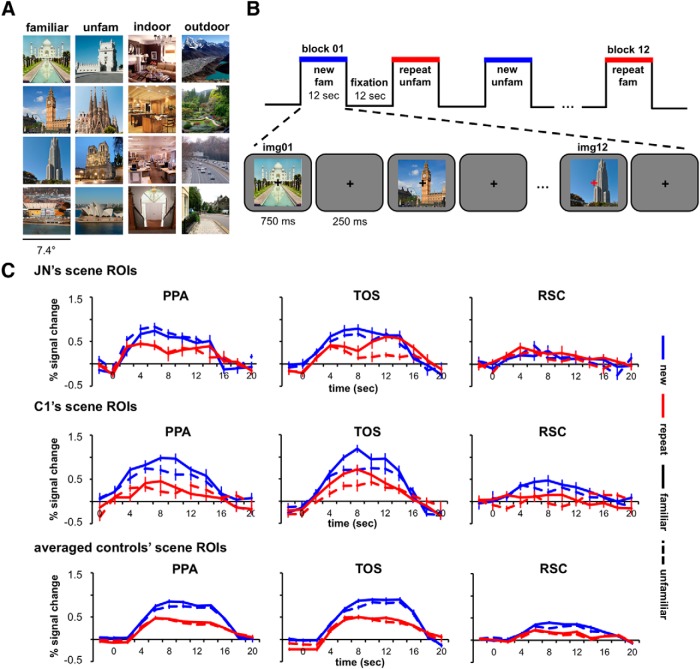
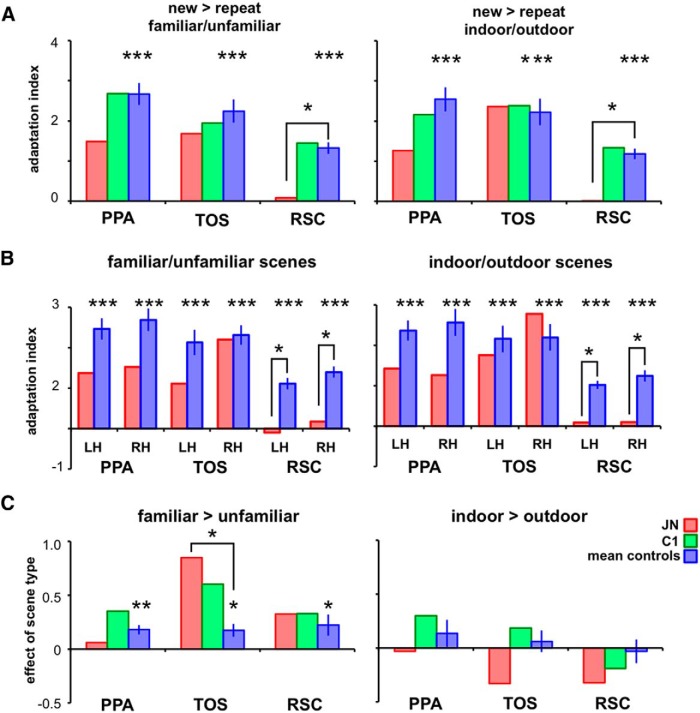
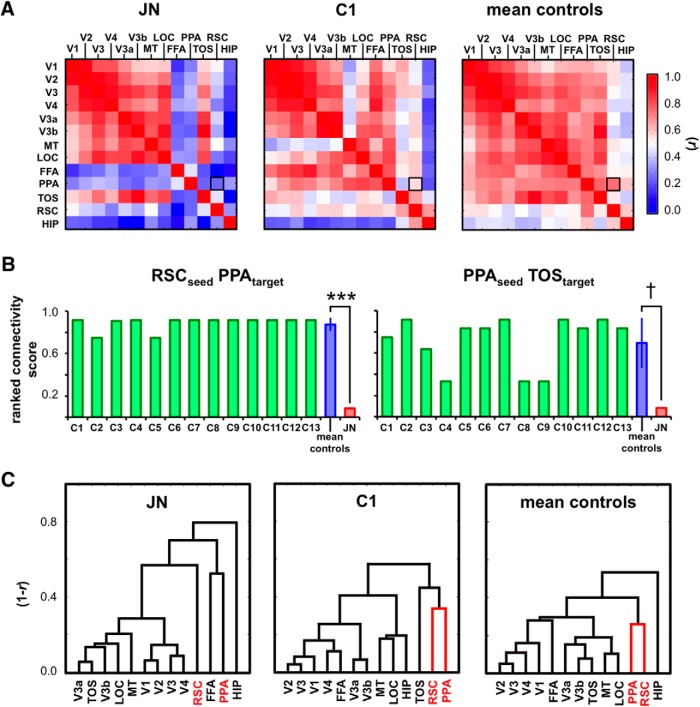
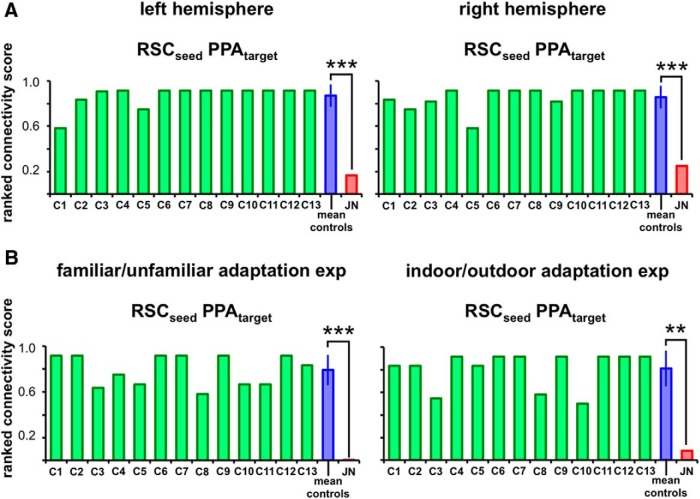
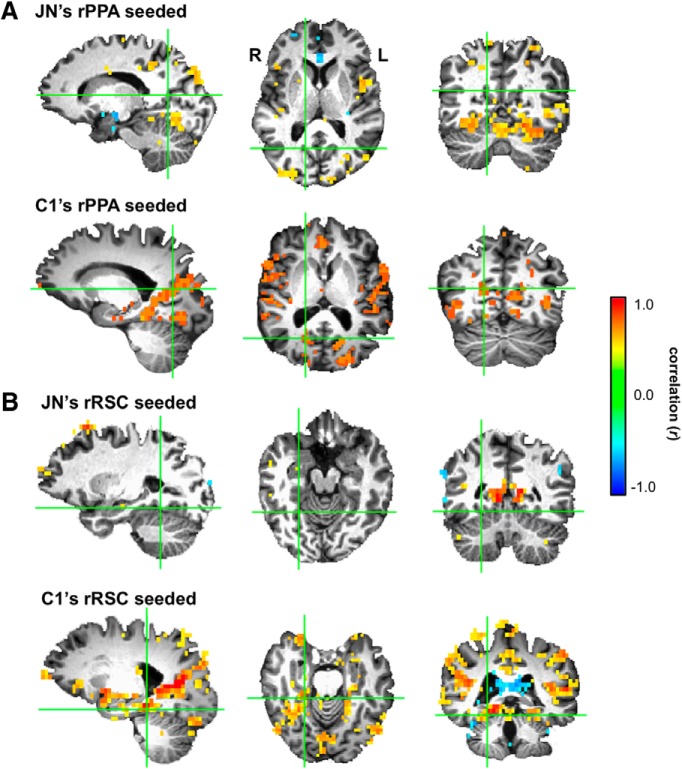
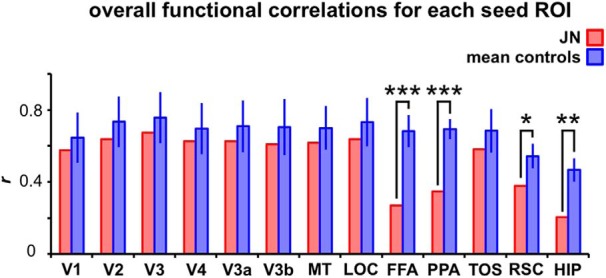
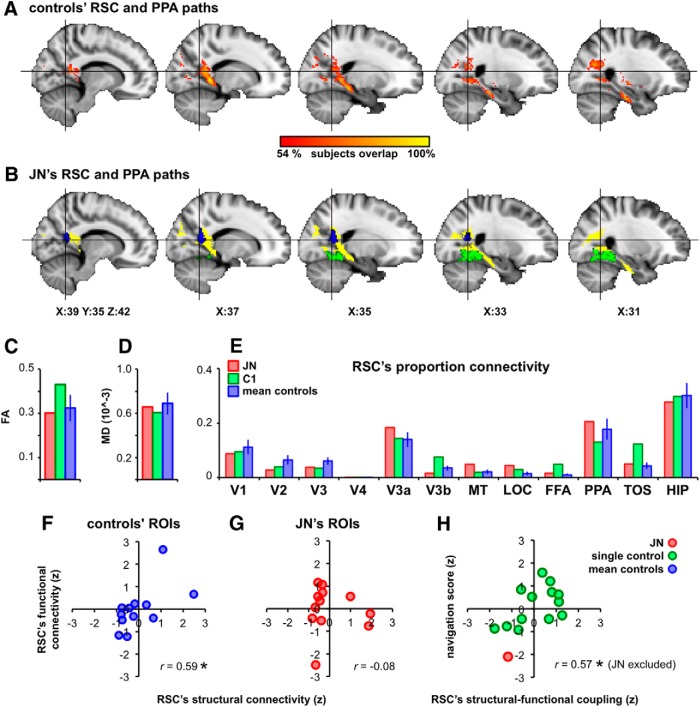
Developmental topographic disorientation (DTD) is a life-long condition in which affected individuals are severely impaired in navigating around their environment. Individuals with DTD have no apparent structural brain damage on conventional imaging and the neural mechanisms underlying DTD are currently unknown. Using functional and diffusion tensor imaging, we present a comprehensive neuroimaging study of an individual, J.N., with well defined DTD. J.N. has intact scene-selective responses in the parahippocampal place area (PPA), transverse occipital sulcus, and retrosplenial cortex (RSC), key regions associated with scene perception and navigation. However, detailed fMRI studies probing selective tuning properties of these regions, as well as functional connectivity, suggest that J.N.'s RSC has an atypical response profile and an atypical functional coupling to PPA compared with human controls. This deviant functional profile of RSC is not due to compromised structural connectivity. This comprehensive examination suggests that the RSC may play a key role in navigation-related processing and that an alteration of the RSC's functional properties may serve as the neural basis for DTD.
Significance statement: Individuals with developmental topographic disorientation (DTD) have a life-long impairment in spatial navigation in the absence of brain damage, neurological conditions, or basic perceptual or memory deficits. Although progress has been made in identifying brain regions that subserve normal navigation, the neural basis of DTD is unknown. Using functional and structural neuroimaging and detailed statistical analyses, we investigated the brain regions typically involved in navigation and scene processing in a representative DTD individual, J.N. Although scene-selective regions were identified, closer scrutiny indicated that these areas, specifically the retrosplenial cortex (RSC), were functionally disrupted in J.N. This comprehensive examination of a representative DTD individual provides insight into the neural basis of DTD and the role of the RSC in navigation-related processing.
Keywords: developmental topographic disorientation; navigation; parahippocampal place area; retrosplenial cortex; scene perception; transverse occipital sulcus.
Copyright © 2015 the authors 0270-6474/15/3512954-16$15.00/0.
Figures
Similar articles
-
A Posterior-Anterior Distinction between Scene Perception and Scene Construction in Human Medial Parietal Cortex.J Neurosci. 2019 Jan 23;39(4):705-717. doi: 10.1523/JNEUROSCI.1219-18.2018. Epub 2018 Nov 30. J Neurosci. 2019. PMID: 30504281 Free PMC article.
-
Functional Subdomains within Scene-Selective Cortex: Parahippocampal Place Area, Retrosplenial Complex, and Occipital Place Area.J Neurosci. 2016 Oct 5;36(40):10257-10273. doi: 10.1523/JNEUROSCI.4033-14.2016. J Neurosci. 2016. PMID: 27707964 Free PMC article.
-
The occipital place area represents the local elements of scenes.Neuroimage. 2016 May 15;132:417-424. doi: 10.1016/j.neuroimage.2016.02.062. Epub 2016 Feb 27. Neuroimage. 2016. PMID: 26931815 Free PMC article.
-
Parahippocampal and retrosplenial contributions to human spatial navigation.Trends Cogn Sci. 2008 Oct;12(10):388-96. doi: 10.1016/j.tics.2008.07.004. Epub 2008 Aug 28. Trends Cogn Sci. 2008. PMID: 18760955 Free PMC article. Review.
-
Human spatial navigation: Neural representations of spatial scales and reference frames obtained from an ALE meta-analysis.Neuroimage. 2021 Sep;238:118264. doi: 10.1016/j.neuroimage.2021.118264. Epub 2021 Jun 12. Neuroimage. 2021. PMID: 34129948 Review.
Cited by
-
Expedition Cognition: A Review and Prospective of Subterranean Neuroscience With Spaceflight Applications.Front Hum Neurosci. 2018 Oct 30;12:407. doi: 10.3389/fnhum.2018.00407. eCollection 2018. Front Hum Neurosci. 2018. PMID: 30425628 Free PMC article. Review.
-
Functions of ventral visual cortex after bilateral medial temporal lobe damage.Prog Neurobiol. 2020 Aug;191:101819. doi: 10.1016/j.pneurobio.2020.101819. Epub 2020 May 4. Prog Neurobiol. 2020. PMID: 32380224 Free PMC article.
-
Functional brain networks in Developmental Topographical Disorientation.Cereb Cortex. 2024 Apr 1;34(4):bhae104. doi: 10.1093/cercor/bhae104. Cereb Cortex. 2024. PMID: 38566506 Free PMC article.
-
Retrosplenial Cortical Neurons Encode Navigational Cues, Trajectories and Reward Locations During Goal Directed Navigation.Cereb Cortex. 2017 Jul 1;27(7):3713-3723. doi: 10.1093/cercor/bhw192. Cereb Cortex. 2017. PMID: 27473323 Free PMC article.
-
Functional Connectivity of the Scene Processing Network at Rest Does Not Reliably Predict Human Behavior on Scene Processing Tasks.eNeuro. 2025 Feb 12;12(2):ENEURO.0375-24.2024. doi: 10.1523/ENEURO.0375-24.2024. Print 2025 Feb. eNeuro. 2025. PMID: 39890456 Free PMC article.
References
Publication types
MeSH terms
Grants and funding
LinkOut - more resources
Full Text Sources
Miscellaneous