

Bypasses in intracellular glucose metabolism in iron-limited Pseudomonas putida
- PMID: 26377487
- PMCID: PMC4767421
- DOI: 10.1002/mbo3.287
Bypasses in intracellular glucose metabolism in iron-limited Pseudomonas putida
Abstract
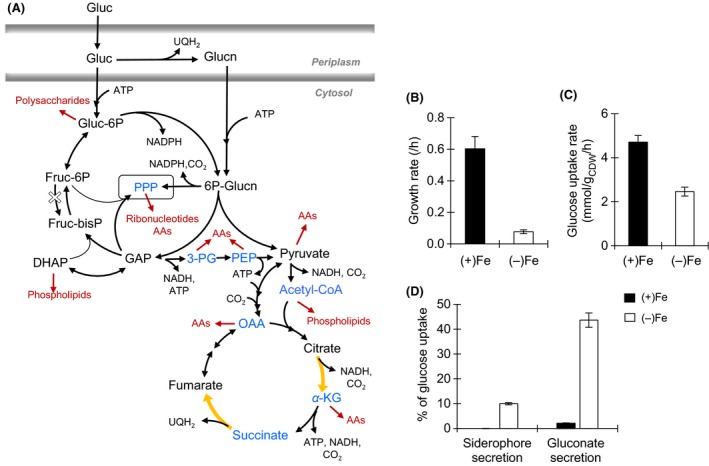
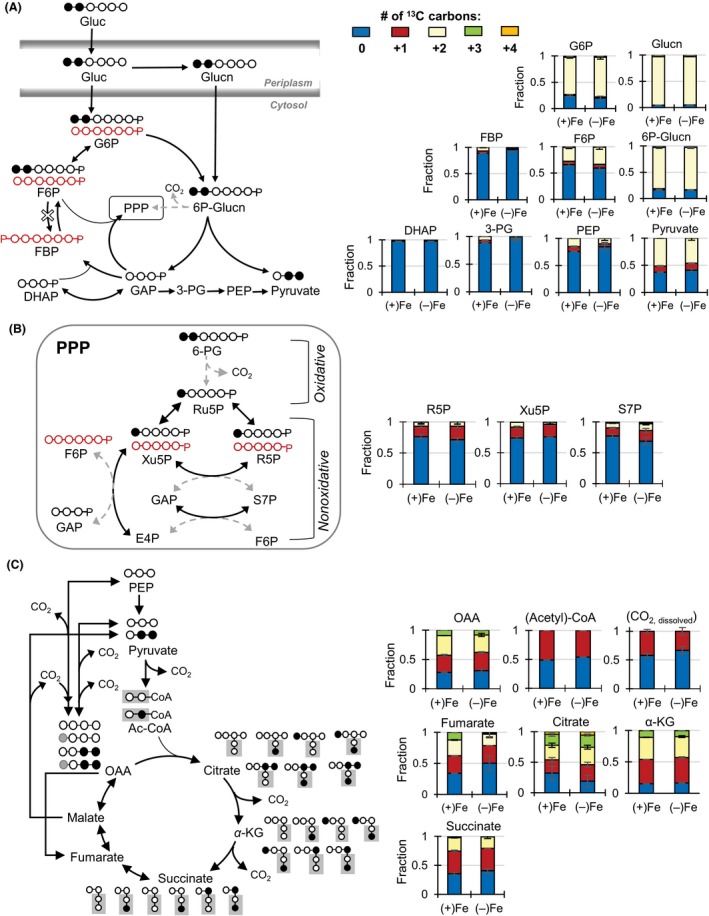
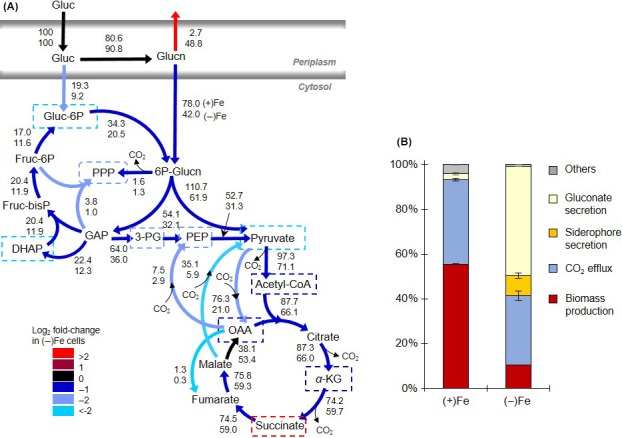
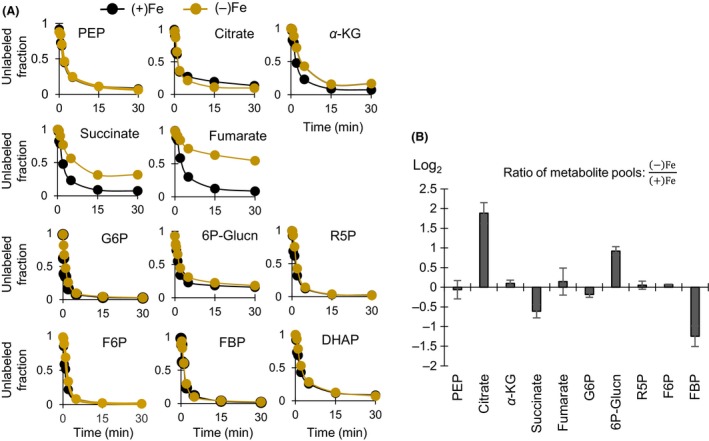
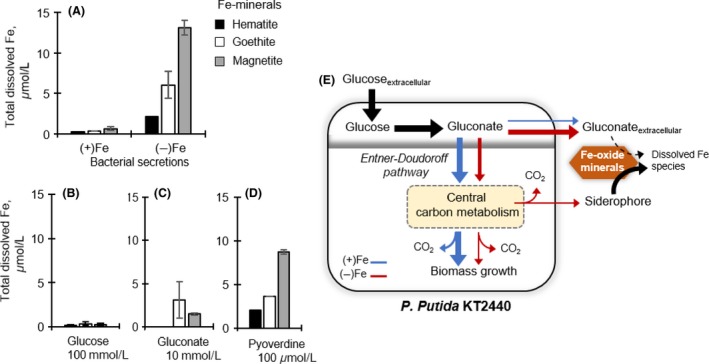
Decreased biomass growth in iron (Fe)-limited Pseudomonas is generally attributed to downregulated expression of Fe-requiring proteins accompanied by an increase in siderophore biosynthesis. Here, we applied a stable isotope-assisted metabolomics approach to explore the underlying carbon metabolism in glucose-grown Pseudomonas putida KT2440. Compared to Fe-replete cells, Fe-limited cells exhibited a sixfold reduction in growth rate but the glucose uptake rate was only halved, implying an imbalance between glucose uptake and biomass growth. This imbalance could not be explained by carbon loss via siderophore production, which accounted for only 10% of the carbon-equivalent glucose uptake. In lieu of the classic glycolytic pathway, the Entner-Doudoroff (ED) pathway in Pseudomonas is the principal route for glucose catabolism following glucose oxidation to gluconate. Remarkably, gluconate secretion represented 44% of the glucose uptake in Fe-limited cells but only 2% in Fe-replete cells. Metabolic (13) C flux analysis and intracellular metabolite levels under Fe limitation indicated a decrease in carbon fluxes through the ED pathway and through Fe-containing metabolic enzymes. The secreted siderophore was found to promote dissolution of Fe-bearing minerals to a greater extent than the high extracellular gluconate. In sum, bypasses in the Fe-limited glucose metabolism were achieved to promote Fe availability via siderophore secretion and to reroute excess carbon influx via enhanced gluconate secretion.
Keywords: Pseudomonas; gluconate; glucose metabolism; iron limitation; pyoverdine; siderophore.
© 2015 The Authors. MicrobiologyOpen published by John Wiley & Sons Ltd.
Figures
Similar articles
-
Hierarchical routing in carbon metabolism favors iron-scavenging strategy in iron-deficient soil Pseudomonas species.Proc Natl Acad Sci U S A. 2020 Dec 22;117(51):32358-32369. doi: 10.1073/pnas.2016380117. Epub 2020 Dec 3. Proc Natl Acad Sci U S A. 2020. PMID: 33273114 Free PMC article.
-
GC-MS-based 13C metabolic flux analysis resolves the parallel and cyclic glucose metabolism of Pseudomonas putida KT2440 and Pseudomonas aeruginosa PAO1.Metab Eng. 2019 Jul;54:35-53. doi: 10.1016/j.ymben.2019.01.008. Epub 2019 Mar 1. Metab Eng. 2019. PMID: 30831266
-
Pumping iron to keep fit: modulation of siderophore secretion helps efficient aromatic utilization in Pseudomonas putida KT2440.Microbiology (Reading). 2014 Jul;160(Pt 7):1393-1400. doi: 10.1099/mic.0.079277-0. Epub 2014 Apr 17. Microbiology (Reading). 2014. PMID: 24742959
-
Iron uptake by fungi: contrasted mechanisms with internal or external reduction.Adv Microb Physiol. 2000;43:39-74. doi: 10.1016/s0065-2911(00)43002-x. Adv Microb Physiol. 2000. PMID: 10907554 Review.
-
Gene regulation of siderophore-mediated iron acquisition in Pseudomonas: not only the Fur repressor.Mol Microbiol. 1995 Aug;17(4):603-10. doi: 10.1111/j.1365-2958.1995.mmi_17040603.x. Mol Microbiol. 1995. PMID: 8801415 Review.
Cited by
-
Analogous Metabolic Decoupling in Pseudomonas putida and Comamonas testosteroni Implies Energetic Bypass to Facilitate Gluconeogenic Growth.mBio. 2021 Dec 21;12(6):e0325921. doi: 10.1128/mbio.03259-21. Epub 2021 Dec 14. mBio. 2021. PMID: 34903058 Free PMC article.
-
Engineering Pseudomonas putida for production of 3-hydroxyacids using hybrid type I polyketide synthases.Metab Eng Commun. 2025 Apr 2;20:e00261. doi: 10.1016/j.mec.2025.e00261. eCollection 2025 Jun. Metab Eng Commun. 2025. PMID: 40248344 Free PMC article.
-
Metabolic Interactions between Brachypodium and Pseudomonas fluorescens under Controlled Iron-Limited Conditions.mSystems. 2021 Jan 5;6(1):e00580-20. doi: 10.1128/mSystems.00580-20. mSystems. 2021. PMID: 33402348 Free PMC article.
-
A Cyclic Metabolic Network in Pseudomonas protegens Pf-5 Prioritizes the Entner-Doudoroff Pathway and Exhibits Substrate Hierarchy during Carbohydrate Co-Utilization.Appl Environ Microbiol. 2018 Dec 13;85(1):e02084-18. doi: 10.1128/AEM.02084-18. Print 2019 Jan 1. Appl Environ Microbiol. 2018. PMID: 30366991 Free PMC article.
-
Transcriptomic Study of Substrate-Specific Transport Mechanisms for Iron and Carbon in the Marine Copiotroph Alteromonas macleodii.mSystems. 2020 Apr 28;5(2):e00070-20. doi: 10.1128/mSystems.00070-20. mSystems. 2020. PMID: 32345736 Free PMC article.
References
-
- Andrews, S. C. , Robinson A. K., and Rodriguez‐Quiñones F.. 2003. Bacterial iron homeostasis. FEMS Microbiol. Rev. 27:215–237. - PubMed
-
- Avis, T. J. , Gavel V., Antoun H., and Tweddell R. J.. 2008. Multifaceted beneficial effects of rhizosphere microorganisms on plant health and productivity. Soil Biol. Biochem. 40:1733–1740.
Publication types
MeSH terms
Substances
LinkOut - more resources
Full Text Sources
Other Literature Sources
