. 2015 Dec;148(2):443-59.
doi: 10.1093/toxsci/kfv193. Epub 2015 Sep 16.

The AhR and NF-κB/Rel Proteins Mediate the Inhibitory Effect of 2,3,7,8-Tetrachlorodibenzo-p-Dioxin on the 3' Immunoglobulin Heavy Chain Regulatory Region

Affiliations

The AhR and NF-κB/Rel Proteins Mediate the Inhibitory Effect of 2,3,7,8-Tetrachlorodibenzo-p-Dioxin on the 3' Immunoglobulin Heavy Chain Regulatory Region

Richard L Salisbury et al. Toxicol Sci. 2015 Dec.

Abstract

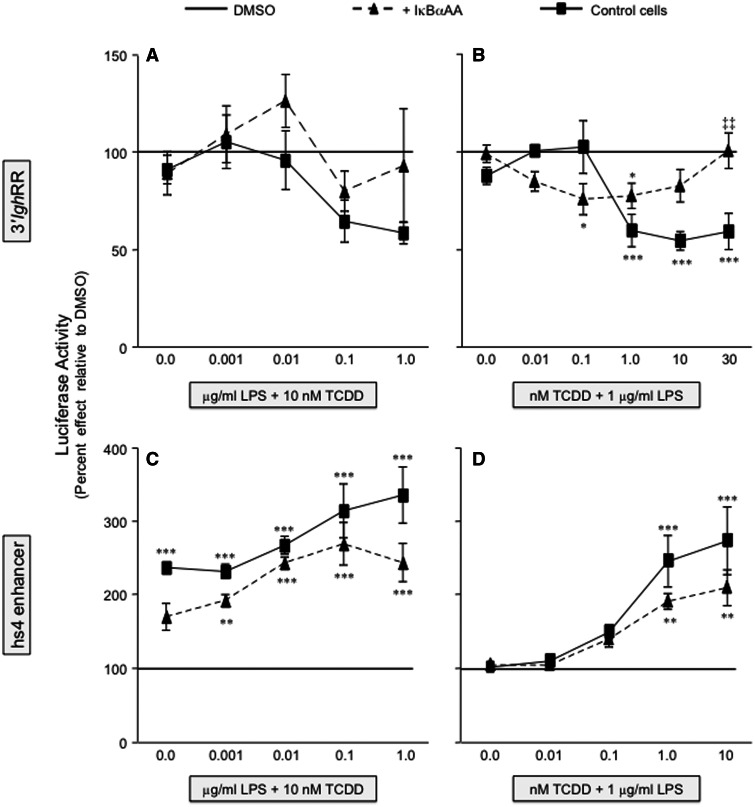
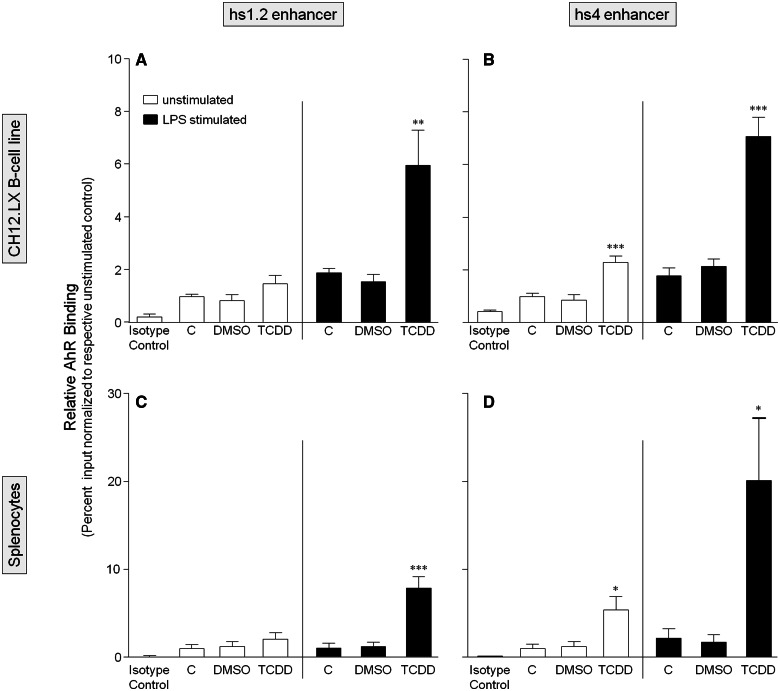
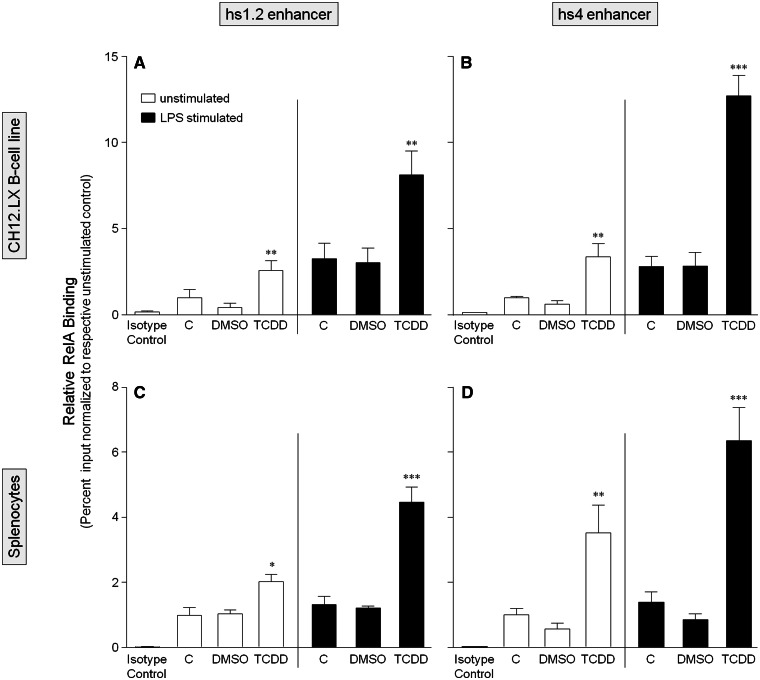
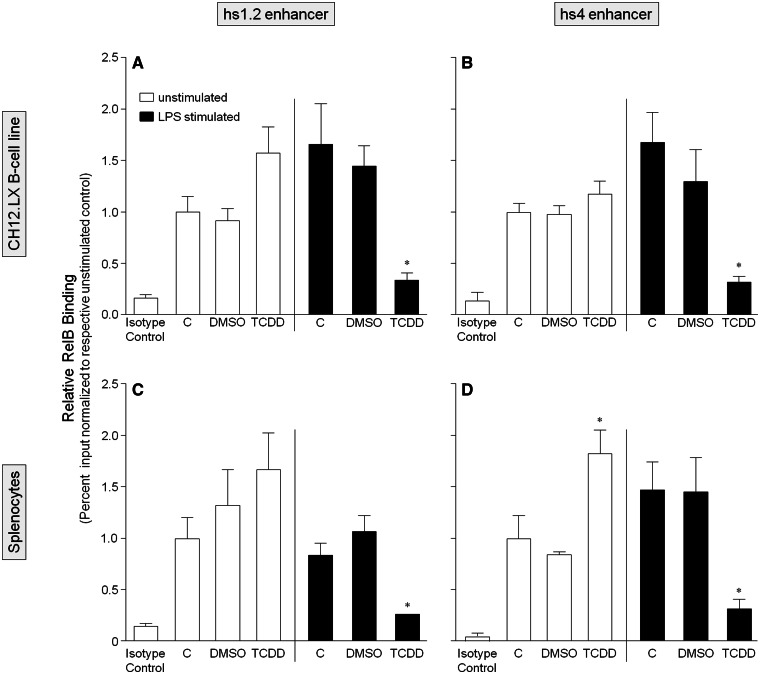
Transcriptional regulation of the murine immunoglobulin (Ig) heavy chain gene (Igh) involves several regulatory elements including the 3'Igh regulatory region (3'IghRR), which is composed of at least 4 enhancers (hs3A, hs1.2, hs3B, and hs4). The hs1.2 and hs4 enhancers exhibit the greatest transcriptional activity and contain binding sites for several transcription factors including nuclear factor kappaB/Rel (NF-κB/Rel) proteins and the aryl hydrocarbon receptor (AhR). Interestingly, the environmental immunosuppressant 2,3,7,8-tetrachlorodibenzo-p-dioxin (TCDD), which potently inhibits antibody secretion, also profoundly inhibits 3'IghRR and hs1.2 enhancer activation induced by the B-lymphocyte activator lipopolysaccharide (LPS), but enhances LPS-induced activation of the hs4 enhancer. Within the hs1.2 and hs4 enhancers, the AhR binding site is in close proximity or overlaps an NF-κB/Rel binding site suggesting a potential reciprocal modulation of the 3'IghRR by AhR and NF-κB/Rel. The objective of the current study was to evaluate the role of NF-κB/Rel and the AhR on the 3'IghRR and its enhancers using the AhR ligand TCDD, the AhR antagonist CH223191, and toll-like receptor agonists LPS, Resiquimod (R848), or cytosine-phosphate-guanine-oligodeoxynucleotides (CpG). Utilizing the CH12.LX B-lymphocyte cell line and variants expressing either a 3'IghRR-regulated transgene reporter or an inducible IκBα (inhibitor kappa B-alpha protein) superrepressor (IκBαAA), we demonstrate an AhR- and NF-κB/Rel-dependent modulation of 3'IghRR and hs4 activity. Additionally, in mouse splenocytes or CH12.LX cells, binding within the hs1.2 and hs4 enhancer of the AhR and the NF-κB/Rel proteins RelA and RelB was differentially altered by the cotreatment of LPS and TCDD. These results suggest that the AhR and NF-κB/Rel protein binding profile within the 3'IghRR mediates the inhibitory effects of TCDD on Ig expression and therefore antibody levels.

Keywords: 3′Igh regulatory region; NF-κB/Rel; TCDD; aryl hydrocarbon receptor; gene regulation; immunoglobulin; immunosuppression.


Figures

FIG. 1.
FIG. 1.
2,3,7,8-Tetrachlorodibenzo-p-dioxin (TCDD) is a general inhibitor of the 3′IghRR. CH12.γ2b-3′IghRR cells were treated with increasing concentrations of TCDD (0–30 nM) and cotreated with the following toll-like receptor ligands: A, R848 (1 μg/ml); B, CpG (1 μM); or A and B, LPS (1 μg/ml). The LPS and TCDD cotreatment served as a positive control for TCDD-induced inhibition of the 3′IghRR. 3′IghRR-regulated γ2b transgene expression (n = 3 per treatment group) normalized to 2 μg total protein was determined by enzyme-linked immunosorbent assay. Results were normalized to the appropriate vehicle control set to 100%, ie, cotreatment of 0.01% dimethyl sulfoxide (vehicle control denoted as 0.0 nM TCDD) and stimulation. The means from 3 separate experiments (overall mean ± SE) are represented in the bar graph. The stimulation index for LPS, R848, and CpG did not differ significantly and was approximately 3-fold above the unstimulated, naive control. Statistical significance was determined by a 1-way ANOVA followed by Dunnett’s Multiple Comparison test. “**” and “***” denote significance from the vehicle control (0.0 nM TCDD) at P < .01 and P < .001, respectively. R848, Resiquimod; CpG, cytosine-phosphate-guanine (TLR9 agonist); LPS, lipopolysaccharide (TLR4 agonist); 3′IghRR, mouse 3′Igh regulatory region.
FIG. 2.
FIG. 2.
AhR expression and function in the CH12.IκBαAA cells. CH12.LX (denoted LX) and CH12.IκBαAA cells (pretreated with [+] or without [−] 100 μM IPTG for 2 h) were incubated for 1 h (A) or 12 h (B) in the absence of further treatment or in the presence of 1 μg/ml LPS with or without a 10 nM TCDD cotreatment. “NA” denotes the unstimulated control. Whole cell protein was isolated and analyzed by Western blot analysis. An anti-AhR antibody identified the AhR protein (approximately 95 kDa) and β-actin served as a loading control. Results are representative of at least 3 separate experiments. C, CH12.LX or CH12.IκBαAA cells were pretreated for 1 h with media alone, dimethyl sulfoxide (DMSO) or the AhR antagonist CH223191 (AhRA, 10 or 30 µM). The cells were then treated with DMSO or 10 nM TCDD and incubated for 8 h. Total RNA was isolated, converted to cDNA, and analyzed by real-time PCR for Cyp1a1 transcripts. Results from 3 to 4 separate RNA isolations per treatment are represented as the relative quantitation (RQ) compared with the respective NA set to 1. The DMSO (0.11% final concentration) vehicle control ranged from less than 1 to 30 RQ and the AhRA alone control ranged from less than 1 to 1.5 RQ (data not shown). Significance between the TCDD+AhRA treatment and the TCDD alone treatment was determined by an unpaired, 2-tailed t test. “**” and “***” denote significance at P < .01 and P < .001, respectively, from the appropriate TCDD treatment. Numbers above bars indicate the percent antagonism induced by the AhRA. AhR, aryl hydrocarbon receptor; CH12.IκBαAA, CH12.LX B-lymphocyte cell line expressing an IPTG-inducible IκBα superrepressor; Cyp1a1, cytochrome P4501a1 gene; IPTG, isopropyl β-d-1-thiogalactopyranoside; LX, CH12.LX parental cells.
FIG. 3.
FIG. 3.
IκBαAA expression abrogates the inhibitory effect of TCDD on 3′IghRR activation. CH12.IκBαAA cells transiently transfected with the VH (variable Ig heavy chain promoter)-Luc-3′IghRR luciferase reporter plasmid (3′IghRR) were either cultured for 2 h in media alone or with IPTG to activate the IκBαAA superrepressor. The cells were then cultured in the absence or presence of increasing concentrations of TCDD with 1 μg/ml LPS (A) or increasing concentrations of LPS with 10 nM TCDD (B). Luciferase enzyme activity is represented on the y-axis as relative light units (mean ± SE, n = 4 per treatment group). For graph A, “NA” denotes the unstimulated control; “C”, the LPS control; and “0.0 nM TCDD”, the 0.01% DMSO control. For graph B, “0.0 μg/ml LPS” denotes the unstimulated control; gray bars are treated with 0.01% DMSO and increasing concentrations of LPS; and checkered bars are treated with 10 nM TCDD and increasing concentrations of LPS. Statistical significance was determined by a 2-way ANOVA followed by a Bonferroni’s post hoc test. “*”, “**”, “***” denote significance at P < .05, P < .01, and P < .001, respectively, from the appropriate vehicle control (0.0 nM TCDD for A or 0.01% DMSO for B). “‡”, “‡‡”, “‡‡‡” denote significance for a specific treatment at P < .05, P < .01, and P < .001, respectively, between the control cells (no IκBαAA) and the cells induced to express the IκBαAA superrepressor (+ IκBαAA). Results are representative of 3 separate experiments. IκBαAA, IκBα superrepressor.
FIG. 4.
FIG. 4.
IκBαAA expression blunts the synergistic activation of hs4 by TCDD and LPS stimulation. CH12.IκBαAA cells transiently transfected with the VH-Luc-hs4 luciferase reporter plasmid (hs4 enhancer) were either cultured for 2 h in media alone or with IPTG to activate the IκBαAA superrepressor. The cells were then cultured in the absence or presence of increasing concentrations of TCDD with 1 μg/ml LPS (A) or increasing concentrations of LPS with 10 nM TCDD (B). Luciferase enzyme activity is represented on the y-axis as relative light units (mean ± SE, n = 4 per treatment group). For graph (A), “NA” denotes the unstimulated control; “C,” the LPS control; and “0.0 nM TCDD,” the 0.01% DMSO control. For graph (B), “0.0 μg/ml LPS” denotes the unstimulated control; gray bars are treated with 0.01% DMSO and increasing concentrations of LPS; and checkered bars are treated with 10 nM TCDD and increasing concentrations of LPS. Statistical significance was determined by a 2-way ANOVA followed by a Bonferroni’s post hoc test. “***” denote significance at P < .001 from the appropriate vehicle control (0.0 nM TCDD for [A] or 0.01% DMSO for [B]). “‡” and “‡‡‡” denote significance for a specific treatment at P < .05 and P < .001, respectively, between the control cells (no IκBαAA) and the cells induced to express the IκBαAA superrepressor (+ IκBαAA). Results are representative of at least 3 separate experiments.
FIG. 5.
FIG. 5.
IκBαAA expression abrogates the inhibitory effect of TCDD on 3′IghRR activation and reduces the synergistic activation of hs4. The CH12.IκBαAA cells were transiently transfected with VH-Luc-3′IghRR (A and B) or VH-Luc-hs4 (C and D) and treated with either increasing concentrations of LPS (A and C) or increasing concentrations of TCDD (B and D). Luciferase enzyme activity (a single representative experiment is shown in Figs. 3 and 4) was normalized to percent effect relative to the appropriate DMSO vehicle control (represented by the line at 100%) and the mean from 3 separate experiments (n = 3–4 per treatment group) was averaged and represented on the y-axis as the overall mean ± SE. Statistical significance was determined by a 2-way ANOVA followed by a Bonferroni’s post hoc test. “*,” “**,” “***” denote significance at P < .05, P < .01, and P < .001, respectively, from the appropriate vehicle control (0.01% DMSO for [A] and [C]; 0.01% DMSO + 1 μg/ml LPS for [B] and [D]), which is represented by the line at 100%. “‡‡” denotes significance for a specific treatment at P < .01, respectively, between the control cells (no IκBαAA) and the cells induced to express the IκBαAA superrepressor (+ IκBαAA). Results are the overall average ± SE of 3 separate experiments.
FIG. 6.
FIG. 6.
Antagonism of the AhR reverses the inhibitory effect of TCDD on 3′IghRR activation and partially reverses the synergistic activation of hs4. CH12.LX cells were transiently transfected with VH-Luc-3′IghRR (A) or VH-Luc-hs4 (B) and pretreated for 1 h with DMSO or 30 µM CH223191 (AhR antagonist, AhRA) then treated with DMSO or 10 nM TCDD in the presence of 1 µg/ml LPS stimulation. Results were normalized to the appropriate vehicle control set to 100%, ie, cotreatment of 0.11% DMSO (vehicle control, represented as “C”) and stimulation; and the means from 3 to 4 separate experiments (overall mean ± SE) are represented in the bar graph. The vehicle control did not significantly differ from the LPS alone control (data not shown). Statistical significance was determined by a 1-way ANOVA followed by Dunnett’s Multiple Comparison test. “**” denotes significance from the vehicle control (C) at P < .01. “‡” and “‡‡” denote significance of the TCDD+AhRA treatment group from the TCDD treatment group at P < .05 and P < .01, respectively. Results are the overall average± SE of 3–4 separate experiments.
FIG. 7.
FIG. 7.
TCDD alone only increases AhR binding within the hs4 enhancer but TCDD and LPS stimulation synergistically increases AhR binding within both the hs1.2 and hs4 enhancers of the 3′IghRR. CH12.LX cells (A and B) or mouse splenocytes (C and D) were treated with 0.01% DMSO or 30 nM TCDD in the absence or presence of 1 µg/ml LPS stimulation and incubated for 90 min. The cells were then cross-linked with formaldehyde and the chromatin was immunoprecipitated with an anti-AhR antibody. Immunoprecipitated chromatin was analyzed by PCR and represented as % input as described in the Materials and Methods. Each bar represents the overall mean ± SE of 3–4 separate experiments. “C” denotes the naïve (white bar) or LPS (black bar) control. The isotype control represents chromatin immunoprecipitation with polyclonal IgG. Statistical significance was determined by a 1-way ANOVA followed by Bonferroni’s Multiple Comparison test to determine significance within unstimulated or stimulated samples. There was no significant difference between the LPS-stimulated and naïve controls. “*,” “**,” and “***” denote significance from the appropriate DMSO control at P < .05, P < .01, and P < .001, respectively. Results are the overall average ± SE of 3–4 separate experiments.
FIG. 8.
FIG. 8.
TCDD alone increases RelA binding within both the hs1.2 and hs4 enhancers of the 3′IghRR but TCDD and LPS stimulation synergistically increases RelA binding within both enhancers. CH12.LX cells (A and B) or mouse splenocytes (C and D) were treated with 0.01% DMSO or 30 nM TCDD in the absence or presence of 1 µg/ml LPS stimulation and incubated for 90 min. The cells were then cross-linked with formaldehyde and the chromatin was immunoprecipitated with an anti-RelA antibody. Immunoprecipitated chromatin was analyzed by PCR and represented as % input as described in the Materials and Methods. Each bar represents the overall mean ± SE of 3–4 separate experiments. “C” denotes the naïve (white bar) or LPS (black bar) control. The isotype control represents chromatin immunoprecipitation with polyclonal IgG. Statistical significance was determined by a 1-way ANOVA followed by Bonferroni’s Multiple Comparison test to determine significance within unstimulated or stimulated samples. There was no significant difference between the LPS-stimulated and naïve controls. “*,” “**,” and “***” denote significance from the appropriate DMSO control at P < .05, P < .01, and P < .001, respectively. Results are the overall average ± SE of 3–4 separate experiments.
FIG. 9.
FIG. 9.
TCDD and LPS stimulation markedly decreases RelB binding within both the hs1.2 and hs4 enhancers of the 3′IghRR. CH12.LX cells (A and B) or mouse splenocytes (C and D) were treated with 0.01% DMSO or 30 nM TCDD in the absence or presence of 1 µg/ml LPS stimulation and incubated for 90 min. The cells were then cross-linked with formaldehyde and the chromatin was immunoprecipitated with an anti-RelB antibody. Immunoprecipitated chromatin was analyzed by PCR and represented as % input as described in the Materials and Methods. Each bar represents the overall mean ± SE of 3–4 separate experiments. “C” denotes the naïve (white bar) or LPS (black bar) control. The isotype control represents chromatin immunoprecipitation with polyclonal IgG. Statistical significance was determined by a 1-way ANOVA followed by Bonferroni’s Multiple Comparison test to determine significance within unstimulated or stimulated samples. There was no significant difference between the LPS-stimulated and naïve controls. “*” denotes significance from the LPS-stimulated DMSO control at P < .05. Results are the overall average ± SE of 3–4 separate experiments.
FIG. 10.
FIG. 10.
Schematic representation of mouse Igh regulation by the AhR and NF-κB/Rel proteins. A schematic depicting a portion of the mouse Igh gene locus including the VDJ antigen recognition region, the 3′ most Igh constant region Cα, which will encode for the heavy chain of IgA, and the regulatory elements: variable Igh promoter (VH), µ or intronic enhancer (Eµ), intronic promoter for Cα (Iα), and the 3′Igh regulatory region (3′IghRR) with its 4 enhancer regions (ie, hypersensitive sites [hs] hs3A, hs1.2, hs3B, and hs4). Long-range interactions between the 3′IghRR and the VH promoter and the intronic promoters just upstream of each constant region are noted with arrows from the 3′IghRR to these sites (Birshtein, 2014). The AhR and NF-κB/Rel nuclear pathways are depicted and show (1) TCDD-induced AhR activation and the prototypical response of Cyp1a1 induction; (2) toll-like receptor activation of NF-κB/Rel proteins, which can form various homo- or heterodimers and upregulate or downregulate the expression of various genes; and (3) crosstalk between the AhR and NF-κB/Rel proteins. The typical NF-κB/Rel heterodimers following IκBα degradation are depicted and will largely be RelA-p50 and less so of c-Rel-p50. Excess RelB not bound by inactivated, unprocessed p100 can be sequestered by IκBs, including IκBα (inhibitor kappa B-alpha protein) (Millet et al., 2013). The potential interactions between the AhR and the NF-κB/Rel proteins RelA and RelB are shown, which may account for the changes in RelA versus RelB binding within the hs1.2 and hs4 enhancers following TCDD and LPS cotreatment. The inhibitory effects of TCDD on LPS-induced 3′IghRR activation, Igh expression, and Ig secretion are depicted by(formula image
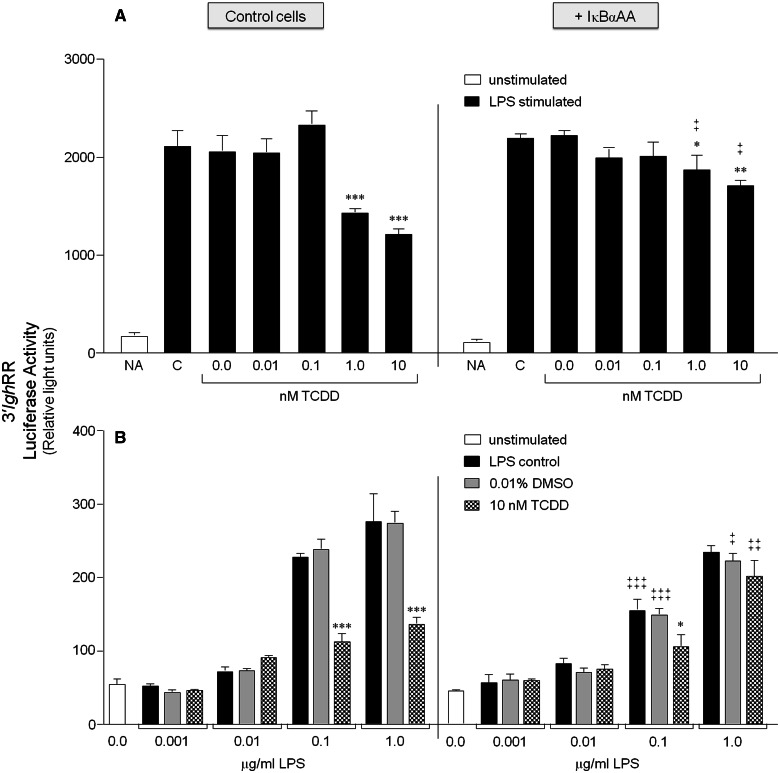
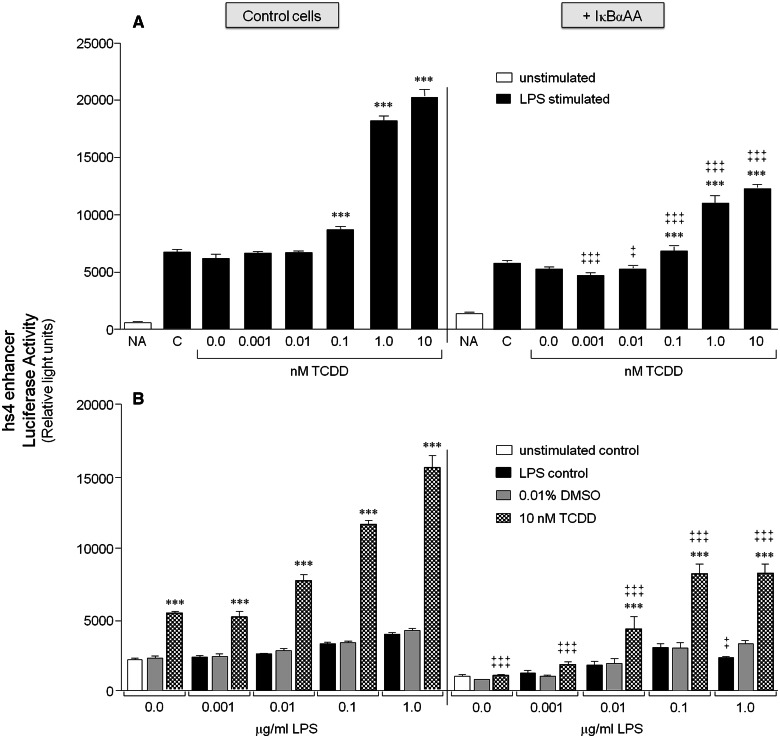
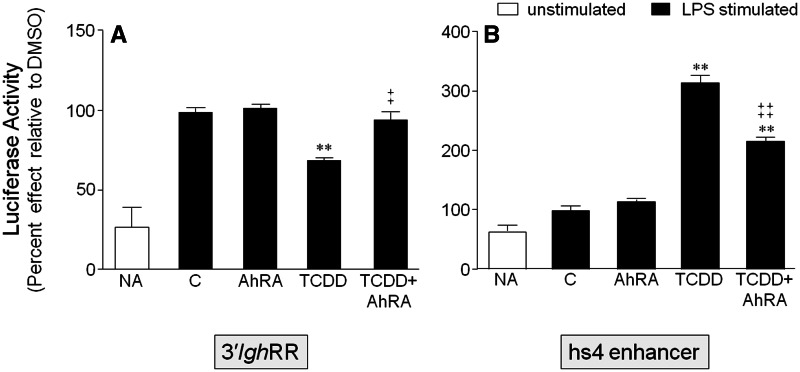
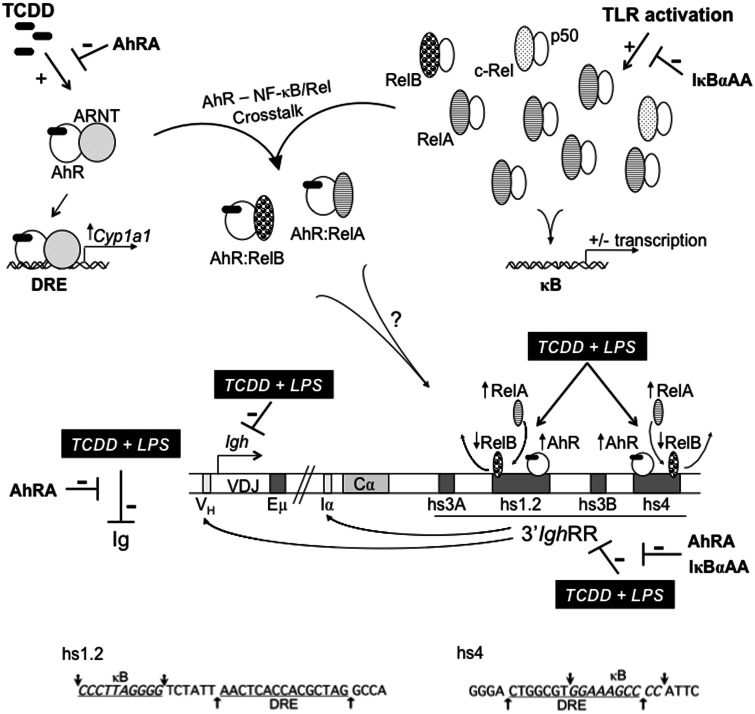
). The inhibitory effects of the AhR antagonist (AhRA) and the IκBαAA superrepressor are also illustrated. Nucleotide sequences for the κB (NF-κB/Rel DNA binding motif) (italicized, top arrows) and DRE (dioxin-responsive element) (bottom arrows) motifs are shown for the hs1.2 and hs4 enhancers; arrows indicate the boundary for each binding site.

Similar articles

Cited by

References

    1. Abdou A. G., Hanout H. M. (2008). Evaluation of survivin and NF-kappaB in psoriasis, an immunohistochemical study. J. Cutan. Pathol. 35, 445–451. - PubMed
    1. Arnold L. W., LoCascio N. J., Lutz P. M., Pennell C. A., Klapper D., Haughton G. (1983). Antigen-induced lymphomagenesis: Identification of a murine B cell lymphoma with known antigen specificity. J. Immunol. 131, 2064–2068. - PubMed
    1. Ashizawa M., Miyazaki M., Abe K., Furusu A., Isomoto H., Harada T., Ozono Y., Sakai H., Koji T., Kohno S. (2003). Detection of nuclear factor-kappaB in IgA nephropathy using Southwestern histochemistry. Am. J. Kidney Dis. 42, 76–86. - PubMed
    1. Aupetit C., Drouet M., Pinaud E., Denizot Y., Aldigier J. C., Bridoux F., Cogne M. (2000). Alleles of the alpha1 immunoglobulin gene 3′ enhancer control evolution of IgA nephropathy toward renal failure. Kidney Int. 58, 966–971. - PubMed
    1. Beischlag T. V., Luis Morales J., Hollingshead B. D., Perdew G. H. (2008). The aryl hydrocarbon receptor complex and the control of gene expression. Crit. Rev. Eukaryot. Gene Expr. 18, 207–250. - PMC - PubMed

Publication types

MeSH terms