

The Double-Reduction Landscape in Tetraploid Potato as Revealed by a High-Density Linkage Map
- PMID: 26377683
- PMCID: PMC4649655
- DOI: 10.1534/genetics.115.181008
The Double-Reduction Landscape in Tetraploid Potato as Revealed by a High-Density Linkage Map
Erratum in
-
Corrigendum.Genetics. 2016 May;203(1):611. doi: 10.1534/genetics.115.188623. Genetics. 2016. PMID: 27183567 Free PMC article. No abstract available.
Abstract
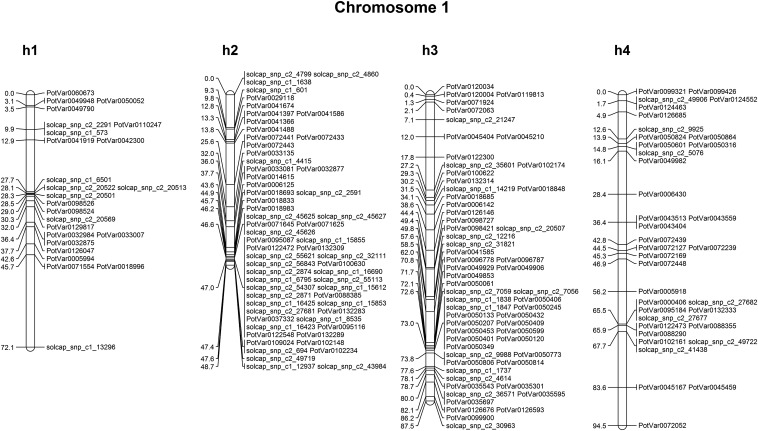
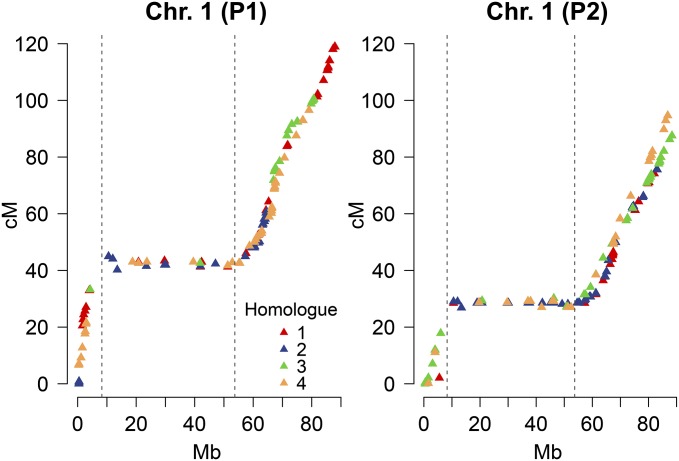
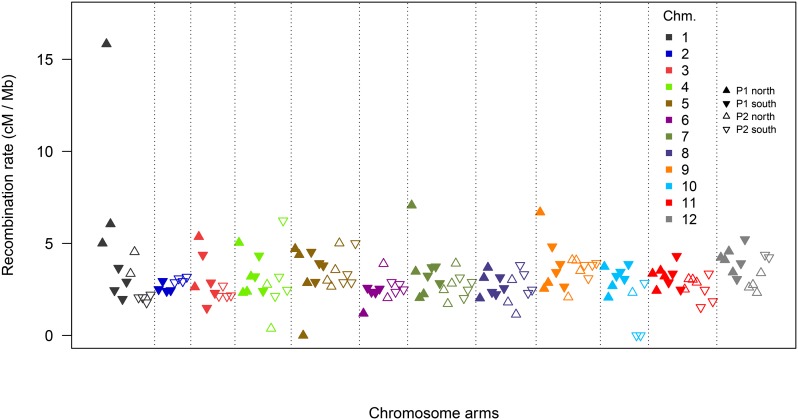
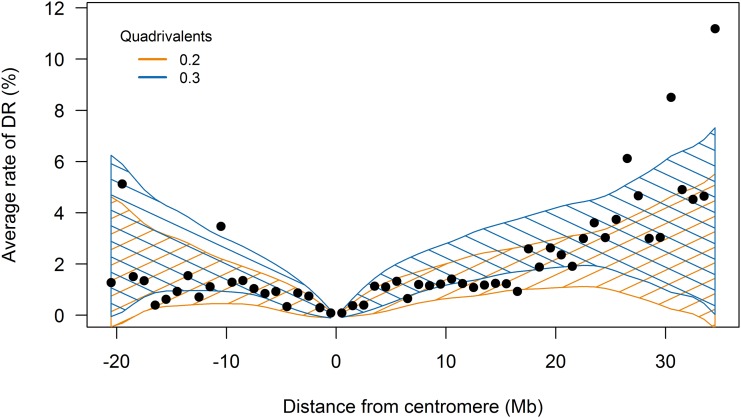
The creation of genetic linkage maps in polyploid species has been a long-standing problem for which various approaches have been proposed. In the case of autopolyploids, a commonly used simplification is that random bivalents form during meiosis. This leads to relatively straightforward estimation of recombination frequencies using maximum likelihood, from which a genetic map can be derived. However, autopolyploids such as tetraploid potato (Solanum tuberosum L.) may exhibit additional features, such as double reduction, not normally encountered in diploid or allopolyploid species. In this study, we produced a high-density linkage map of tetraploid potato and used it to identify regions of double reduction in a biparental mapping population. The frequency of multivalents required to produce this degree of double reduction was determined through simulation. We also determined the effect that multivalents or preferential pairing between homologous chromosomes has on linkage mapping. Low levels of multivalents or preferential pairing do not adversely affect map construction when highly informative marker types and phases are used. We reveal the double-reduction landscape in tetraploid potato, clearly showing that this phenomenon increases with distance from the centromeres.
Keywords: double reduction; linkage mapping; multivalents; potato; tetraploid.
Copyright © 2015 by the Genetics Society of America.
Figures
References
-
- Andrade J., Estévez-Pérez M., 2014. Statistical comparison of the slopes of two regression lines: a tutorial. Anal. Chim. Acta 838: 1–12. - PubMed
-
- Bains G. S., 1951. Cytological studies in the genus Solanum, sect. Tuberarium. MSc. Dissertation, Univ. Cambridge.
-
- Benjamini Y., Hochberg Y., 1995. Controlling the false discovery rate: a practical and powerful approach to multiple testing. J. R. Statist. Soc. B 57: 289–300.
-
- Bradshaw J., 2007. The canon of potato science. 4. Tetrasomic inheritance. Potato Res. 50: 219–222.
-
- Bradshaw J. E., Pande B., Bryan G. J., Hackett C. A., McLean K., et al. , 2004. Interval mapping of quantitative trait loci for resistance to late blight [Phytophthora infestans (Mont.) de Bary], height and maturity in a tetraploid population of potato (Solanum tuberosum subsp. tuberosum). Genetics 168: 983–995. - PMC - PubMed
Publication types
MeSH terms
Substances
LinkOut - more resources
Full Text Sources
Other Literature Sources
