

Objectively measured physical activity and sedentary time in youth: the International children's accelerometry database (ICAD)
- PMID: 26377803
- PMCID: PMC4574095
- DOI: 10.1186/s12966-015-0274-5
Objectively measured physical activity and sedentary time in youth: the International children's accelerometry database (ICAD)
Abstract
Background: Physical activity and sedentary behaviour in youth have been reported to vary by sex, age, weight status and country. However, supporting data are often self-reported and/or do not encompass a wide range of ages or geographical locations. This study aimed to describe objectively-measured physical activity and sedentary time patterns in youth.
Methods: The International Children's Accelerometry Database (ICAD) consists of ActiGraph accelerometer data from 20 studies in ten countries, processed using common data reduction procedures. Analyses were conducted on 27,637 participants (2.8-18.4 years) who provided at least three days of valid accelerometer data. Linear regression was used to examine associations between age, sex, weight status, country and physical activity outcomes.
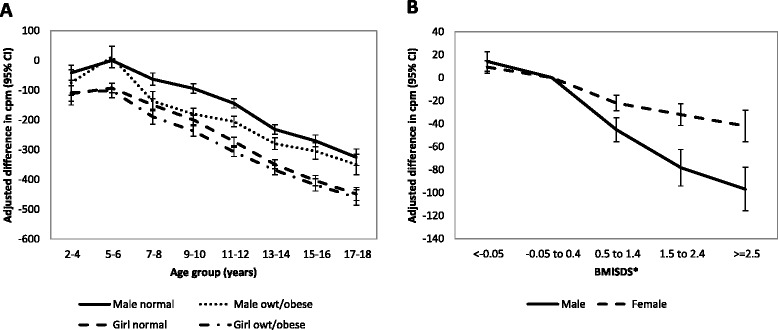
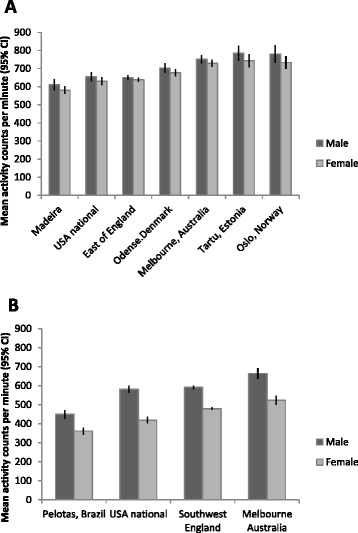
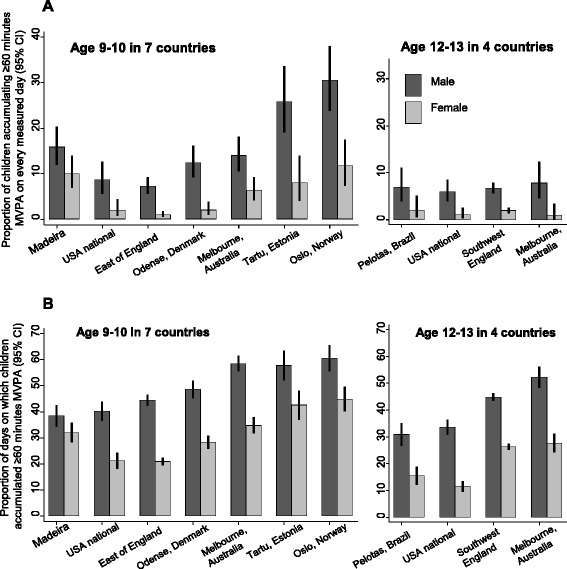
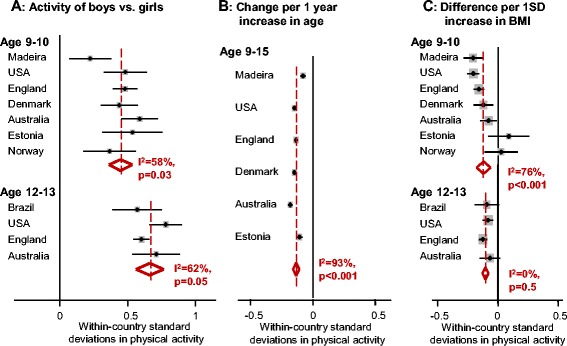
Results: Boys were less sedentary and more active than girls at all ages. After 5 years of age there was an average cross-sectional decrease of 4.2% in total physical activity with each additional year of age, due mainly to lower levels of light-intensity physical activity and greater time spent sedentary. Physical activity did not differ by weight status in the youngest children, but from age seven onwards, overweight/obese participants were less active than their normal weight counterparts. Physical activity varied between samples from different countries, with a 15-20% difference between the highest and lowest countries at age 9-10 and a 26-28% difference at age 12-13.
Conclusions: Physical activity differed between samples from different countries, but the associations between demographic characteristics and physical activity were consistently observed. Further research is needed to explore environmental and sociocultural explanations for these differences.
Figures

References
-
- WHO . Global recommendations on physical activity for health. Geneva: World Health Organisation; 2010. - PubMed
Publication types
MeSH terms
Grants and funding
- MC_UP_1001/2/MRC_/Medical Research Council/United Kingdom
- G0501294/MRC_/Medical Research Council/United Kingdom
- MR/K023187/1/MRC_/Medical Research Council/United Kingdom
- BHF_/British Heart Foundation/United Kingdom
- MC_UU_12015/3/MRC_/Medical Research Council/United Kingdom
- 095582/WT_/Wellcome Trust/United Kingdom
- MC_UU_12015/7/MRC_/Medical Research Council/United Kingdom
- MC_U106179473/MRC_/Medical Research Council/United Kingdom
- 102215/WT_/Wellcome Trust/United Kingdom
- MC_PC_15018/MRC_/Medical Research Council/United Kingdom
- PDF-2010-03-15/DH_/Department of Health/United Kingdom
- G0701877/MRC_/Medical Research Council/United Kingdom
- CSO_/Chief Scientist Office/United Kingdom
- CRUK_/Cancer Research UK/United Kingdom
LinkOut - more resources
Full Text Sources
Other Literature Sources
Medical
