. 2015 Nov;21(11):1943-65.
doi: 10.1261/rna.053389.115. Epub 2015 Sep 16.

A multiprotein occupancy map of the mRNP on the 3' end of histone mRNAs

Affiliations

A multiprotein occupancy map of the mRNP on the 3' end of histone mRNAs

Lionel Brooks 3rd et al. RNA. 2015 Nov.

Abstract

The animal replication-dependent (RD) histone mRNAs are coordinately regulated with chromosome replication. The RD-histone mRNAs are the only known cellular mRNAs that are not polyadenylated. Instead, the mature transcripts end in a conserved stem-loop (SL) structure. This SL structure interacts with the stem-loop binding protein (SLBP), which is involved in all aspects of RD-histone mRNA metabolism. We used several genomic methods, including high-throughput sequencing of cross-linked immunoprecipitate (HITS-CLIP) to analyze the RNA-binding landscape of SLBP. SLBP was not bound to any RNAs other than histone mRNAs. We performed bioinformatic analyses of the HITS-CLIP data that included (i) clustering genes by sequencing read coverage using CVCA, (ii) mapping the bound RNA fragment termini, and (iii) mapping cross-linking induced mutation sites (CIMS) using CLIP-PyL software. These analyses allowed us to identify specific sites of molecular contact between SLBP and its RD-histone mRNA ligands. We performed in vitro crosslinking assays to refine the CIMS mapping and found that uracils one and three in the loop of the histone mRNA SL preferentially crosslink to SLBP, whereas uracil two in the loop preferentially crosslinks to a separate component, likely the 3'hExo. We also performed a secondary analysis of an iCLIP data set to map UPF1 occupancy across the RD-histone mRNAs and found that UPF1 is bound adjacent to the SLBP-binding site. Multiple proteins likely bind the 3' end of RD-histone mRNAs together with SLBP.

Keywords: 3′hExo; CIMS; CLIP-seq; H2A.X; H2AFX; HITS-CLIP; RBPome; RIP-chip; RIP-seq; RNP; SLBP; UPF1; histone mRNA.


Figures

FIGURE 1.
FIGURE 1.
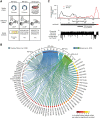
Genome-wide analysis of SLBP RNA ligands. (A) Affinity chromatography strategies for the three different genomic techniques that we utilized are shown. (B) Circos plot (Krzywinski et al. 2009) showing histone genes that have been identified as significantly enriched using RIP-chip, RIP-seq, and HITS-CLIP. Histone3, denoted by (*), indicates the accession number for this annotation in the Known Gene database (Hsu et al. 2006) is uc021yox.1. This is an Rfam entry that maps to the HIST1H2BK gene, which is misannotated. The HIST1H2APS1 gene (†) is a pseudogene, which is not expressed, and the appearance of this gene in the significantly enriched probe set is certainly a microarray cross-hybridization artifact. The H2AFJ gene (‡) does not have a stem–loop, which indicates that this is also likely a microarray cross-hybridization artifact. The H2AFX gene (§) is a notable mRNA target of SLBP because it is bimorphic. (C) Read coverage distributions for the RIP-seq and HITS-CLIP experiments and the microarray probe location for the HIST1H3F gene. The stem–loop region is marked by a red block in the gene model schematic and is highly conserved across placental mammals (Pollard et al. 2010). HITS-CLIP is the only technique that provides direct evidence of the SLBP site. Coverage distribution is expressed as reads per million mapped (RPMM).
FIGURE 2.
FIGURE 2.
Nuclease-resistant histone mRNA stem–loop fragments were prominent in SLBP HITS-CLIP data. (A) Autoradiograph of P32-labeled crosslinked ribonucleoprotein complexes that were isolated during SLBP HITS-CLIP library preparation. Both the experiment and negative controls are on the same gel and are the same exposure, but several intervening lanes were removed. (B) The probability density plots show the sequencing read fragment length distribution of reads that contain a stem–loop motif. (C) Distribution of reads that either contain or do not contain the histone SL in the SLBP HITS-CLIP data. (D) The bar graph shows the number of reads per million (RPM) containing a SL motif sequence for each of the HITS-CLIP libraries that we generated. GFP libraries did not contain an appreciable number of SL-containing reads. (E) Reads that contain SL motifs were mapped to the genome, and the number of reads per million (RPM) is shown for each genomic locus that was detected in each of our HITS-CLIP libraries. Shown are the 95 SL sequences that had at least one read in the HITS-CLIP data. The reads that fall into histone HGNC gene models are shown in black and those not in HGNC gene models are in red. The SL-containing reads primarily mapped to histone genes (shown in color bar).
FIGURE 3.
FIGURE 3.
HITS-CLIP read coverage maps for representative histone mRNA gene models. (A) Representative coverage plots for select RD histone mRNAs are shown. The uniquely mapped reads for the HIST1H3B and HIST1H2AG genes are also shown. Multimapped reads are shown for HIST2H4A, which is a duplicated gene with reads mapping to both gene copies of the gene in the genome sequence. The coverage distributions are expressed as reads per million mapped (RPMM). (B) To identify commonly observed coverage vector shapes across the histone mRNAs, we developed coverage vector correlation analysis (CVCA), which was applied to the 696 coverage vectors derived from 116 histone gene models in the six different conditions. Symmetric correlation map shows each of the 696 coverage vectors plotted against one another and the correlation coefficient is indicated in the heatmap. We find three major clusters that are labeled A, B, and C. (C) The mean coverage vector for each group is displayed. Average coverage vector for the three clusters found by CVCA show two distinct shapes and one comprised of background level reads. The vectors in group C are either histone genes not expressed, non-replication-dependent histone genes, or correspond to vectors from the GFP controls. (D) Proportion of histone gene models found in each cluster from C is shown across HITS-CLIP conditions. This quantifies the proportion of genes that are most similar to a given coverage shape.
FIGURE 4.
FIGURE 4.
Inference of nuclease cleavage sites from HITS-CLIP data maps the boundaries of the SLBP RNP. (A) Cleavage sites were inferred from mapping read termini as depicted. Only termini for which 5′ and 3′ cleavage sites could be mapped were retained and graphed. The sequencing was 36-bp single end and occurred from the 5′ adaptor. (B) A representative coverage plot is shown with coverage expressed as unique reads per million mapped (RPMM) across the HIST1H3F locus (upper panel). A plot of the inferred cleavage sites is also shown for comparison, where the number of cleavage sites per million mapped reads is shown. The inferred cleavage sites precisely flank the histone SL, which is indicated in the gene model schematic as a red block. (C) We used CVCA analysis to group histone genes by the similarity of the inferred cleavage site distributions at each locus using the same HGNC gene models shown in Figure 3. (D) The mean cleavage site vectors show that the cleavage peak is most sharply demarcated at the 3′ region flanking the SL and that there was only a subtle difference between histone genes in clusters A and B, which is a density of cleavage sites internal to the histone SL (see insets). (E,F) We quantified the number of unique RPMM (E) and cleavage rates (F) for each nucleotide in the SL motifs of 75 histone genes for the low MW band (blue) and HMW weight band (orange). (G,H) Seqlogos (WebLogo 3.3) were generated from a multiple alignment of SLBP HITS-CLIP reads containing the histone SL motif (G) and for the DNA sequence for 3′ end of the histone genes (H). Note that the x axis is the same for the boxplots (E,F) and the seqlogos (G,H) to display the sequence composition of the nuclease-resistant histone SL RNA fragments. (I) We used the AppEnD tool (Welch et al. 2015) to identify nontemplated tails on the 3′ ends of histone RNA molecules present in HITS-CLIP reads. To avoid calling sequencing errors as tails, only reads that extended at least 4 nt into the 3′ adapter were analyzed. The bar chart shows abundances of unmodified tails (blue), 1-nt tails (green), and 2-nt tails (red) by position from 3′ end for all histone mRNAs. (J,K) The length and composition of the nontemplated tails were determined. (L) Examples of types of reads found on the HIST2HAC RNA are shown. The 3′ end of the RNA that mapped to the genome (black) is followed by any nontemplated nucleotides (red) and the 3′ linker (blue).
FIGURE 5.
FIGURE 5.
Proteins in the SLBP immunoprecipitate interact with H2AFX mRNA at two distinct sites. (A) Schematics of the short and long H2AFX mRNA isoforms are shown. (B,C) The RNA-seq data sets from Yang et al. (2011) produced by sequencing the (B) polyadenylated and (C) nonpolyadenylated fractions of HeLa cell mRNA isolates were aligned and displayed. Reads per million mapped reads (RPMM) is plotted for each nucleotide across the bimorphic H2AFX transcript. (D) Analysis of H2AFX mRNA read coverage in our SLBP RIP-seq data set. (E) Analysis of H2AFX mRNA read coverage in our SLBP HITS-CLIP data set. The middle panel shows the HITS-CLIP CIMS (1D rate) with a peak in the histone SL and a peak near the poly(A) site. Shown in the lower panel is the placental mammal conservation which demonstrates conservation of the coding region, histone SL, and the region preceding the poly(A) site. (F) The sites of crosslinking deduced from the sites of indels in the SL and in the sequence adjacent to the poly(A) site are indicated. (G) Comparison of the sequences around the polyadenylation site in the H2AFX gene in different mammals showing the sites of crosslinking defined by the presence of Indels, and the conservation among mammalian species. (H) Total cell RNA from exponentially growing mouse myeloma cells (lanes 2,3) and F9 teratoma cells (lanes 4,5,7,8), or F9 cells treated with cycloheximide for 60 min (lanes 9,10) to freeze the ribosomes and stabilize the stem–loop RNA, were lysed and the histone mRNAs precipitated with anti-SLBP antibody. RNA was prepared from the supernatants (S) and the immunoprecipitates (P) and subjected to S1 nuclease mapping as preciously described (Whitfield et al. 2004). The probe was hybridized with total cell RNA, treated with S1 nuclease, and the protected fragments resolved by electrophoresis on an 8% polyacrylamide-7 M urea gel. Lanes 1 and 6 are markers. The SL form of H2AFX RNA protects a 333-nt fragment, and the polyadenylated form protects a 379 fragment as the probe extends 46 nt past the end of the SL, complementary to the H2AFX gene.
FIGURE 6.
FIGURE 6.
Identification of crosslink-induced mutations (CIMS) in histone mRNA stem–loops. (A) Single nucleotide deletion (1D) rates were quantified across 75 histone SL motifs. The distribution of those rates is summarized by a boxplot spanning each nucleotide in the degenerate motif. (B) The number of genomic occurrences of each stem–loop sequence is indicated by the pseudocolor plot alongside each stem–loop. If a 1D maps to a homopolymer run (highlighted in gray in panel B), then the BWA aligner ascribes the 1D to one of the terminal nucleotides in the run depending on whether the gene is on the plus or minus strand in the genome. (C) We implemented a previously published method (Zhang and Darnell 2011) to compute a test statistic (referred to here as “D-statistic”) to assess enrichment of 1Ds in the loop region. The D-statistic computed for each of the histone genes is depicted as a scatter plot. We calculated a P-value by computing a null distribution for the D-statistic at each stem–loop motif using the resampling method from the previously reported method (Zhang and Darnell 2011). The null distributions are displayed as boxplots. Thirty-nine of the histone stem–loops passed the significance cutoff (P < 0.001). (D) Highlighted are the three uracils in the stem–loop consensus sequence. (E,F) Those uracils are indicated in the stem–loop RNA fragment (E) that is a component of an SLBP:SL:3′hExo crystal structure (PDB4HXH) (Tan et al. 2013). (G) Coverage vectors for two histone genes with different loop sequences. There are three histone genes which contain a UCUN loop: HIST1H2BI (UCUA), HIST1H4L (UCUC), and HIST1H3E (UCUC). HIST1H2BI was expressed at similar levels to the adjacent gene HIST1H2BJ with a UUUA loop. In both public data sets (Yang et al. 2011; Djebali et al. 2012) and in our RIP-seq experiment, these genes were expressed at similar relative levels. The top left graphs show the coverage vector in the poly(A)-RNA-seq data set (Yang et al. 2011). The bottom left row shows the coverage in our SLBP RIP-seq data set. (H) The top right shows the coverage in our SLBP HITS-CLIP data set in the 3 GU/μL Mnase/High MW fraction. The bottom right shows the 1-bp deletions found in each gene model. Each vector is shown relative to the gene model along the x-axis with the 3′ UTR containing the histone SL indicated in red and CDS indicated in black. Quantification of CIMS in the HIST1H2BJ (UUUA) and HIST1H2BI shows accumulation of CIMS in the homopolymer run of uridines across the loop. In HIST1H2BJ the CIMS are located in the stretch of four uridines at the top of the stem and the first 3 nt of the loop, and the precise nucleotide crosslinked cannot be assigned. There are fewer CIMS in the HIST1H2BI with the majority associated with the UU at the top of the stem and first nucleotide in the loop (L1). This most likely represents crosslinking to L1. A small number of CIMs were associated with the naturally occurring L2C.
FIGURE 7.
FIGURE 7.
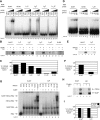
SLBP crosslinks to the L1,3U and the 3′hExo crosslinks primarily to L2U of the loop. (A) Electrophoretic mobility shift assays (EMSAs) were performed to ascertain binding of SLBP to mutant SL sequences. Cytosines were substituted for specific uridines in the loop and the effect on SLBP binding determined by EMSA. A stem–loop reverse sequence (SLRS) that does not bind SLBP was used as a negative control. The position(s) of the mutation(s) in the variant SL probes are indicated: L1C changes the first position in the loop from U to C, L2C changes the second, L3C changes the third, and L1,3C changes both the first and third positions from U to C. (B,C) The ability to crosslink recombinant SLBP to these probes was determined by UV irradiation followed by SDS-gel electrophoresis. The relative crosslinking is shown in the graph. (D) The binding of 3′hExo to the SL wild type (SLWT) (lanes 1–5), SLRS (lanes 6–10), and L2C (lanes 11–15) was measured by EMSA. (E) We carried out in vitro UV crosslinking with the SLWT (lanes 1–3) and L2C (lanes 4–6) probes. (F) The results were quantified by PhosphorImager. (G) We incubated the SLWT (lanes 1–7) and L2C probes (lanes 8–15) with 10 pmol of the SLBP RNA-processing domain and increasing amounts of 3′hExo. A ternary complex was formed in similar amounts with both probes. (H) The complexes with SLWT (lanes 1–3) and the L2C probes (lanes 4–6) were crosslinked with UV light, and the two proteins resolved by SDS-gel electrophoresis. (I) The intensity of crosslinking quantified on a PhosphorImager.
FIGURE 8.
FIGURE 8.
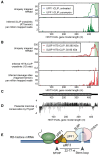
Secondary analysis of a public UPF1 iCLIP data set. We analyzed the data sets of UPF1-iCLIP experiments on untreated HeLa cells and cells treated with puromycin (Zünd et al. 2013) to determine whether UPF1 associated with histone mRNAs. (A) A representative histone mRNA, HIST1H2AL, is shown. The RPMM across the histone mRNA (top) and the reverse transcriptase (RT) termini, which give the site of crosslinking (bottom) are plotted. (B) Our SLBP HITS-CLIP data for the HIST1H2AL gene are shown. The RPMM (top), the single nucleotide deletion (1D) rate (middle), and the fragment termini (bottom) determined using our cleavage-mapping algorithm, are plotted in the 3.0 GU Mnase SLBP HITS-CLIP data from two specified size ranges. (C) The HIST1H2AL gene model graphic is shown below with the CDS and UTRs indicating CDS boundaries. (D) The phyloP (Pollard et al. 2010) placental mammal conservation score (Meyer et al. 2013) is shown for each nucleotide of the mature HIST1H2AL mRNA. (E) A cartoon depicting the potential arrangement of proteins on a generic RD-histone mRNA 3′ end (Isken and Maquat 2008).

Similar articles

Cited by

References

    1. Amrani N, Sachs MS, Jacobson A. 2006. Early nonsense: mRNA decay solves a translational problem. Nat Rev Mol Cell Biol 7: 415–425. - PubMed
    1. Änkö ML, Müller-McNicoll M, Brandl H, Curk T, Gorup C, Henry I, Ule J, Neugebauer KM. 2012. The RNA-binding landscapes of two SR proteins reveal unique functions and binding to diverse RNA classes. Genome Biol 13: R17. - PMC - PubMed
    1. Battle DJ, Doudna JA. 2001. The stem-loop binding protein forms a highly stable and specific complex with the 3′ stem-loop of histone mRNAs. RNA 7: 123–132. - PMC - PubMed
    1. Bonner WM, Mannironi C, Orr A, Pilch DR, Hatch CL. 1993. Histone H2A.X gene transcription is regulated differently than transcription of other replication-linked histone genes. Mol Cell Biol 13: 984–992. - PMC - PubMed
    1. Braastad CD, Hovhannisyan H, van Wijnen AJ, Stein JL, Stein GS. 2004. Functional characterization of a human histone gene cluster duplication. Gene 342: 35–40. - PubMed

Publication types