. 2015 Nov;114(5):2912-22.
doi: 10.1152/jn.00385.2015. Epub 2015 Sep 16.

Automatic reconstruction of physiological gestures used in a model of birdsong production

Affiliations

Automatic reconstruction of physiological gestures used in a model of birdsong production

Santiago Boari et al. J Neurophysiol. 2015 Nov.

Abstract

Highly coordinated learned behaviors are key to understanding neural processes integrating the body and the environment. Birdsong production is a widely studied example of such behavior in which numerous thoracic muscles control respiratory inspiration and expiration: the muscles of the syrinx control syringeal membrane tension, while upper vocal tract morphology controls resonances that modulate the vocal system output. All these muscles have to be coordinated in precise sequences to generate the elaborate vocalizations that characterize an individual's song. Previously we used a low-dimensional description of the biomechanics of birdsong production to investigate the associated neural codes, an approach that complements traditional spectrographic analysis. The prior study used algorithmic yet manual procedures to model singing behavior. In the present work, we present an automatic procedure to extract low-dimensional motor gestures that could predict vocal behavior. We recorded zebra finch songs and generated synthetic copies automatically, using a biomechanical model for the vocal apparatus and vocal tract. This dynamical model described song as a sequence of physiological parameters the birds control during singing. To validate this procedure, we recorded electrophysiological activity of the telencephalic nucleus HVC. HVC neurons were highly selective to the auditory presentation of the bird's own song (BOS) and gave similar selective responses to the automatically generated synthetic model of song (AUTO). Our results demonstrate meaningful dimensionality reduction in terms of physiological parameters that individual birds could actually control. Furthermore, this methodology can be extended to other vocal systems to study fine motor control.

Keywords: bird's own song; dynamical systems; modeling software; peripheral vocal production model; vocal learning.


Figures

Fig. 1.
Fig. 1.
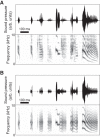
Song recording and synthesis. Recorded zebra finch song (A) and automatically synthesized song (B). The sound signal is shown at top and its corresponding sonogram at bottom. The automatically reconstructed motor instructions that drive the model produce a synthetic copy capturing syllables' fundamental frequency and spectral content.
Fig. 2.
Fig. 2.
Neural selectivity experiment. Electrophysiological recordings of the response activity of an HVC single unit to auditory presentations of different stimuli. The protocol consisted of 20 randomly organized auditory presentations of each stimulus. Neural activity was processed through a spike sorting algorithm (wave_clus). A–D: raster plots of the 20 trials (bottom), poststimulus time histograms (PSTHs; middle) and the sound signal of each stimulus presented (top). E: sonograms for a song motif of each of the presented stimuli. The symbol patterns at bottom are the same as in A–D. The activity elicited as response to the bird's own song (BOS; A) presents a well-defined pattern of excitatory and inhibitory activity; and B shows a similar activity pattern elicited by the automatically synthesized song (AUTO). C and D represent the weak activity in response to presentations of the reverse song (REV) and the song of an adult male conspecific (CON).
Fig. 3.
Fig. 3.
Results in terms of response strength and variability. Results for the set of experiments performed (n = 5 birds, N = 20 HVC single units measured). Thick bars represent the mean value, and error bars represent ±SD of the data. RRS: relative response strength (RRSX/BOS; see Eq. 6): mean RRSAUTO/BOS = (0.63 ± 0.12), which is significantly larger than the mean of RRSCON/BOS (0.20 ± 0.22) and RRSREV/BOS (0.17 ± 0.13). RRV: relative response variability (RRVX/BOS; see Eq. 7): mean RRVAUTO/BOS = 0.73 ± 0.15, which is significantly larger than the mean of RRVCON/BOS (0.24 ± 0.20) and RRVREV/BOS (0.21 ± 0.14). Measurements are corrected in all cases by the spontaneous firing of each unit. Pearson's r: pairwise correlation coefficients: mean rBOS vs. AUTO = 0.41 ± 0.20, which is significantly larger than mean rBOS vs. CON = 0.04 ± 0.15 and mean rBOS vs. REV = 0.03 ± 0.12. *Paired t-test (P < 0.001).
Fig. 4.
Fig. 4.
Neuron presenting higher response to AUTO than to BOS. Same layout and data processing as in Fig. 2 but this time showing the recordings and results for a particular case: a selective HVC neuron that presented locally sharper responses (in terms of the excitatory-inhibitory pattern) to AUTO than to BOS.
Fig. 5.
Fig. 5.
Automatic reconstruction of gesture trajectory extrema (GTEs). Sound pressure (top) and sonogram (middle) of a zebra finch song. GTEs were extracted with a manual method (square dots) and by an automatic procedure (dashed lines, see materials and methods). Automatically extracted GTEs are obtained by finding significant maxima and significant minima of the smoothed envelope of the sound wave (bottom), in addition to syllable onsets and offsets. The procedure to manually extract GTEs is explained in Amador et al. (2013).
Fig. 6.
Fig. 6.
Reliability of GTE automatic extraction. The GTEs from 51 song renditions for 1 bird were calculated. A: sound trace, sonogram, and envelope of 1 example song. B: automatic reconstruction of GTEs for different song renditions. GTE times were linearly scaled to a fixed syllable duration. This takes advantage of the highly reliable estimates of syllable onsets and offsets as a reference frame to study the robustness of GTE timing within a syllable. The dispersion for all the GTEs (excluding onsets and offsets) across all the renditions was 3.4 ± 2.28 ms.

References

    1. Akutagawa E, Konishi M. New brain pathways found in the vocal control system of a songbird. J Comp Neurol 518: 3086–3100, 2010. - PubMed
    1. Amador A, Margoliash D. A mechanism for frequency modulation in songbirds shared with humans. J Neurosci 33: 11136–11144, 2013. - PMC - PubMed
    1. Amador A, Mindlin GB. Beyond harmonic sounds in a simple model for birdsong production. Chaos 18: 043123, 2008. - PubMed
    1. Amador A, Perl YS, Mindlin GB, Margoliash D. Elemental gesture dynamics are encoded by song premotor cortical neurons. Nature 495: 59–64, 2013. - PMC - PubMed
    1. Bauer EE, Coleman MJ, Roberts TF, Roy A, Prather JF, Mooney R. A synaptic basis for auditory-vocal integration in the songbird. J Neurosci 28: 1509–1522, 2008. - PMC - PubMed

Publication types

LinkOut - more resources