

Impact of a Biomarker-Based Strategy on Oncology Drug Development: A Meta-analysis of Clinical Trials Leading to FDA Approval
- PMID: 26378224
- PMCID: PMC4857149
- DOI: 10.1093/jnci/djv253
Impact of a Biomarker-Based Strategy on Oncology Drug Development: A Meta-analysis of Clinical Trials Leading to FDA Approval
Erratum in
-
Erratum.J Natl Cancer Inst. 2016 Jan 4;108(2):djv423. doi: 10.1093/jnci/djv423. Print 2016 Feb. J Natl Cancer Inst. 2016. PMID: 26727926 Free PMC article. No abstract available.
Abstract
Background: In order to ascertain the impact of a biomarker-based (personalized) strategy, we compared outcomes between US Food and Drug Administration (FDA)-approved cancer treatments that were studied with and without such a selection rationale.
Methods: Anticancer agents newly approved (September 1998 to June 2013) were identified at the Drugs@FDA website. Efficacy, treatment-related mortality, and hazard ratios (HRs) for time-to-event endpoints were analyzed and compared in registration trials for these agents. All statistical tests were two-sided.
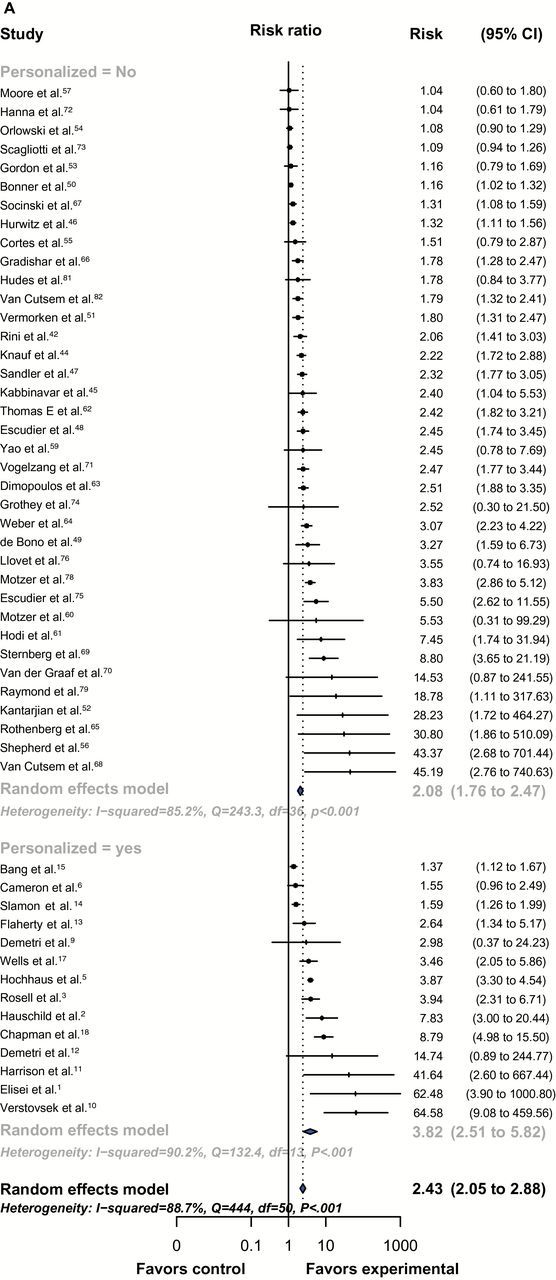
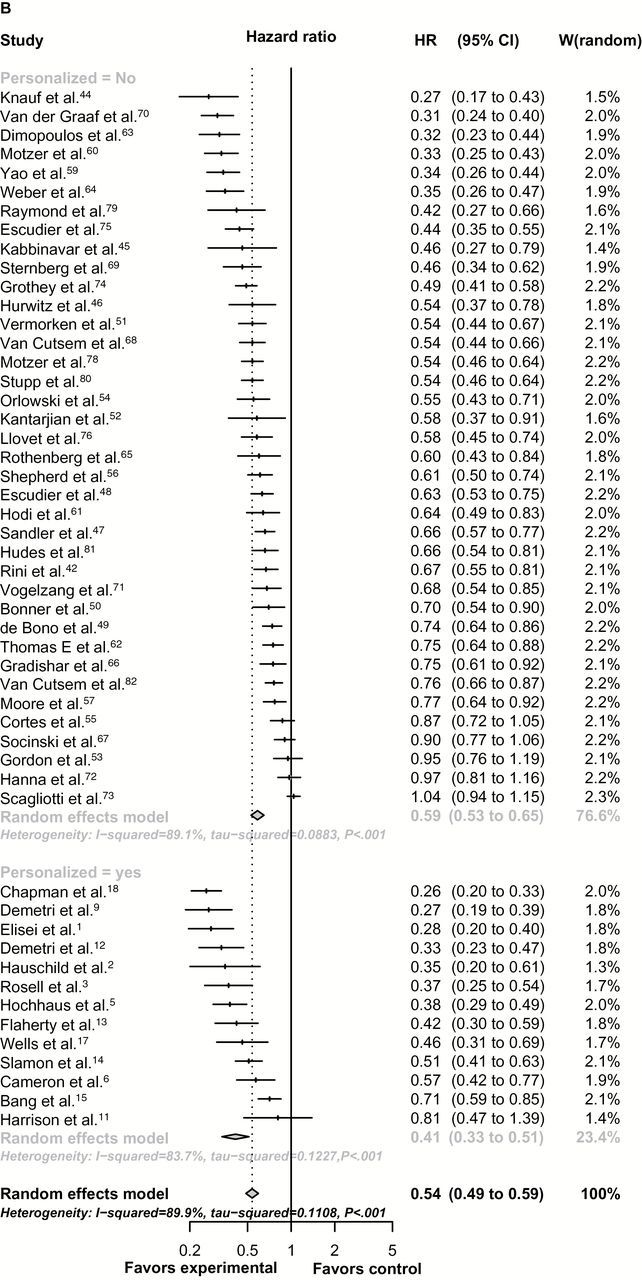
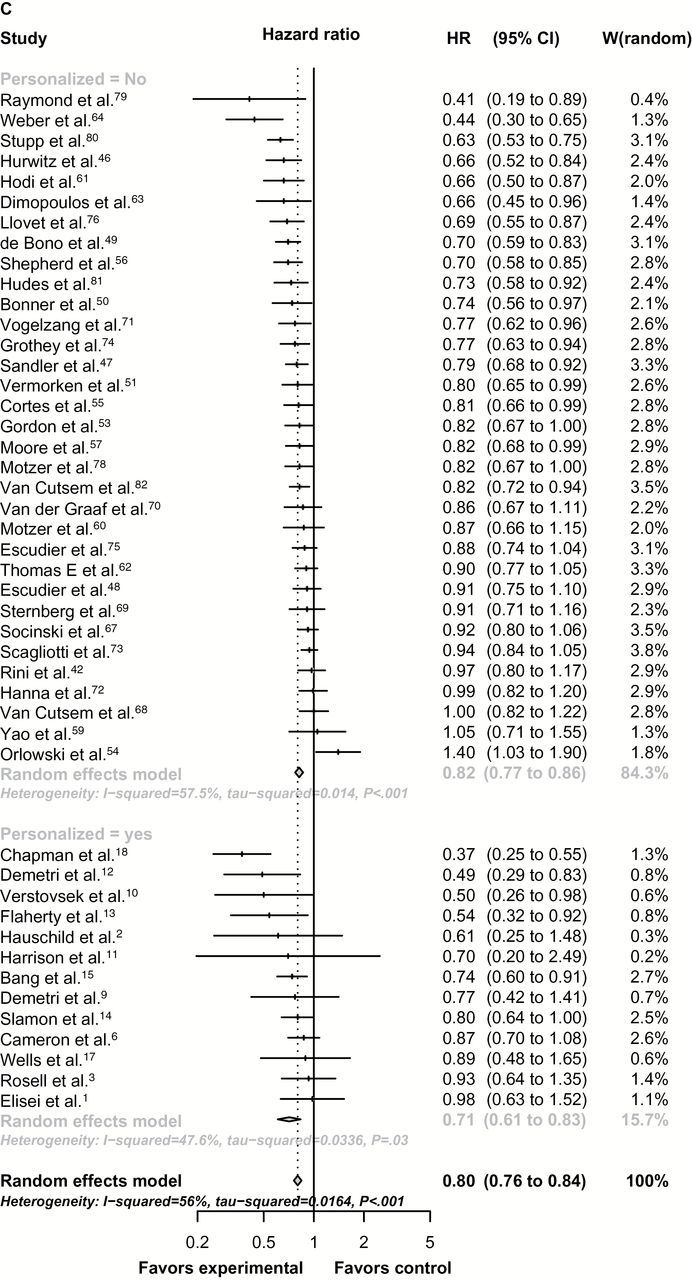
Results: Fifty-eight drugs were included (leading to 57 randomized [32% personalized] and 55 nonrandomized trials [47% personalized], n = 38 104 patients). Trials adopting a personalized strategy more often included targeted (100% vs 65%, P < .001), oral (68% vs 35%, P = .001), and single agents (89% vs 71%, P = .04) and more frequently permitted crossover to experimental treatment (67% vs 28%, P = .009). In randomized registration trials (using a random-effects meta-analysis), personalized therapy arms were associated with higher relative response rate ratios (RRRs, compared with their corresponding control arms) (RRRs = 3.82, 95% confidence interval [CI] = 2.51 to 5.82, vs RRRs = 2.08, 95% CI = 1.76 to 2.47, adjusted P = .03), longer PFS (hazard ratio [HR] = 0.41, 95% CI = 0.33 to 0.51, vs HR = 0.59, 95% CI = 0.53 to 0.65, adjusted P < .001) and a non-statistically significantly longer OS (HR = 0.71, 95% CI = 0.61 to 0.83, vs HR = 0.81, 95% CI = 0.77 to 0.85, adjusted P = .07) compared with nonpersonalized trials. Analysis of experimental arms in all 112 registration trials (randomized and nonrandomized) demonstrated that personalized therapy was associated with higher response rate (48%, 95% CI = 42% to 55%, vs 23%, 95% CI = 20% to 27%, P < .001) and longer PFS (median = 8.3, interquartile range [IQR] = 5 vs 5.5 months, IQR = 5, adjusted P = .002) and OS (median = 19.3, IQR = 17 vs 13.5 months, IQR = 8, Adjusted P = .04). A personalized strategy was an independent predictor of better RR, PFS, and OS, as demonstrated by multilinear regression analysis. Treatment-related mortality rate was similar for personalized and nonpersonalized trials.
Conclusions: A biomarker-based approach was safe and associated with improved efficacy outcomes in FDA-approved anticancer agents.
© The Author 2015. Published by Oxford University Press. All rights reserved. For Permissions, please e-mail: journals.permissions@oup.com.
Figures
Comment in
-
RE: Impact of a Biomarker-Based Strategy on Oncology Drug Development: A Meta-analysis of Clinical Trials Leading to FDA Approval.J Natl Cancer Inst. 2016 Feb 24;108(3):djv430. doi: 10.1093/jnci/djv430. Print 2016 Mar. J Natl Cancer Inst. 2016. PMID: 26912650 Free PMC article. No abstract available.
-
Response.J Natl Cancer Inst. 2016 Feb 24;108(3):djw001. doi: 10.1093/jnci/djw001. Print 2016 Mar. J Natl Cancer Inst. 2016. PMID: 26912651 No abstract available.
References
-
- Sawyers C. Targeted cancer therapy. Nature. 2004;432 (7015):294–297. - PubMed
-
- National Cancer Institute: Targeted cancer therapies. Fact Sheet. http://www.cancer.gov/cancertopics/factsheet/Therapy/targeted Accessed November 25, 2013.
-
- Kantarjian H, Sawyers C, Hochhaus A, et al. Hematologic and cytogenetic responses to imatinib mesylate in chronic myelogenous leukemia. N Engl J Med. 2002;346 (9):645–652. - PubMed
-
- Slamon DJ, Leyland-Jones B, Shak S, et al. Use of chemotherapy plus a monoclonal antibody against HER2 for metastatic breast cancer that overexpresses HER2. N Engl J Med. 2001;344 (11):783–792. - PubMed
