

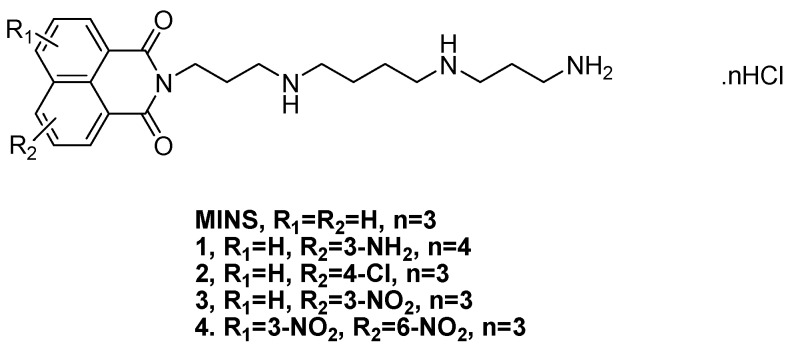
Spectroscopic Study on the Interaction between Naphthalimide-Polyamine Conjugates and Bovine Serum Albumin (BSA)
- PMID: 26378511
- PMCID: PMC6332075
- DOI: 10.3390/molecules200916491
Spectroscopic Study on the Interaction between Naphthalimide-Polyamine Conjugates and Bovine Serum Albumin (BSA)
Abstract
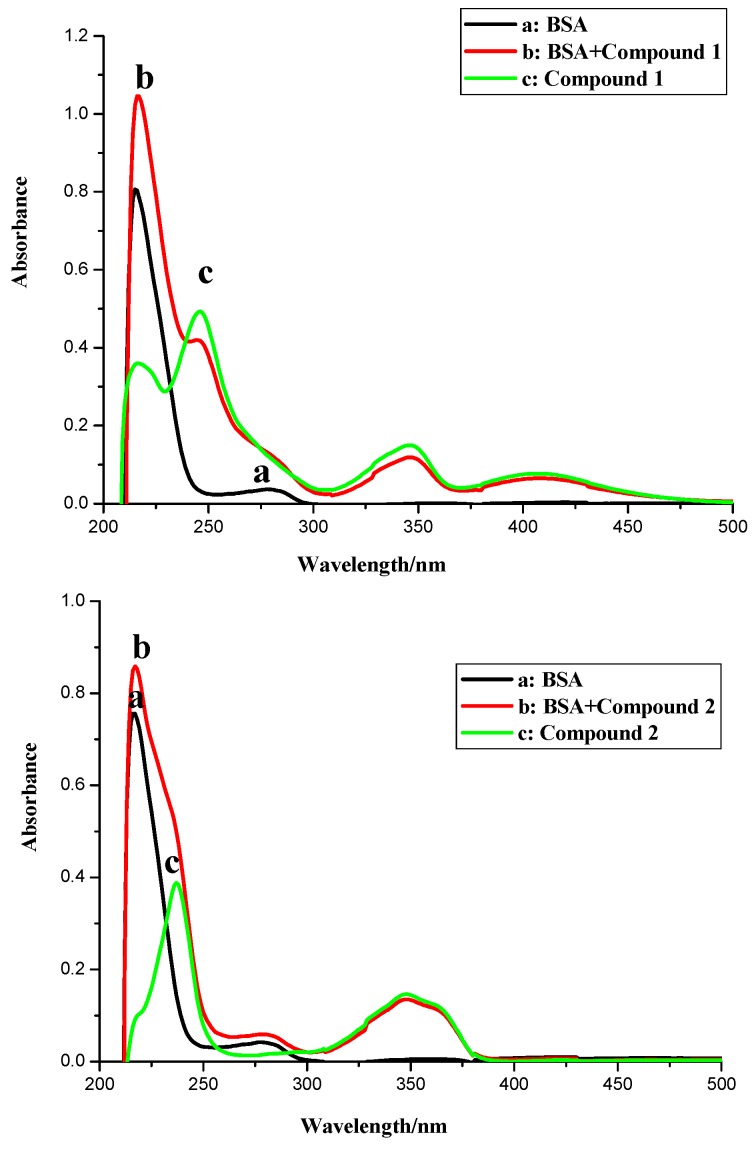
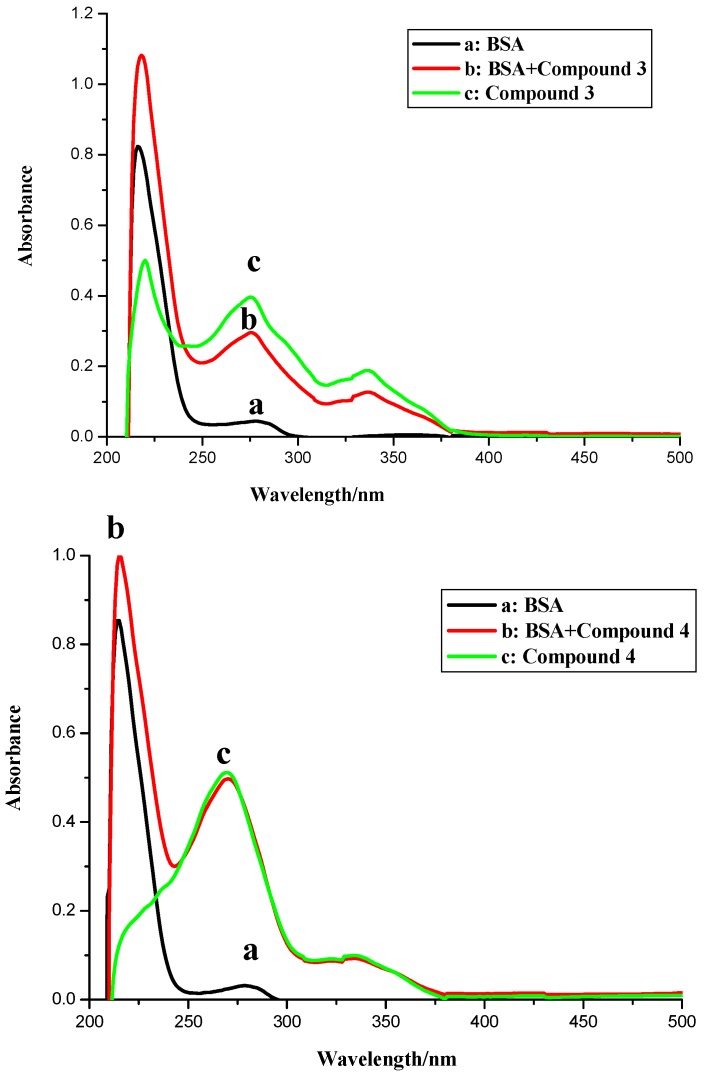
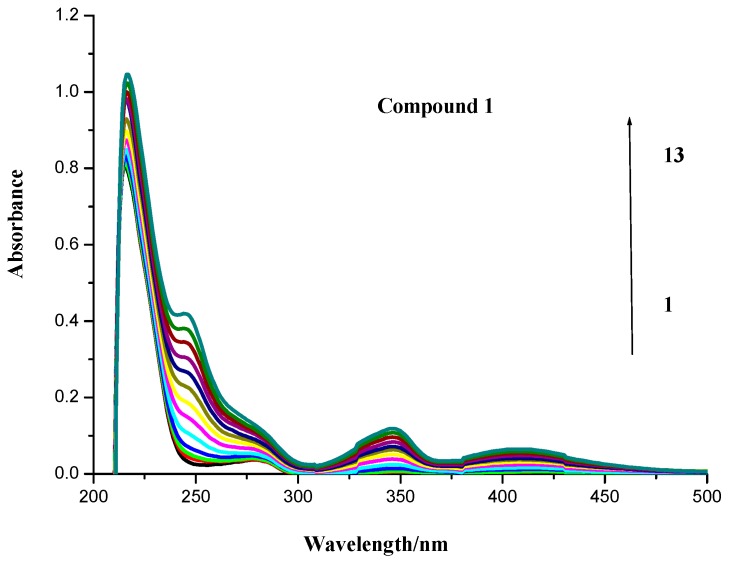
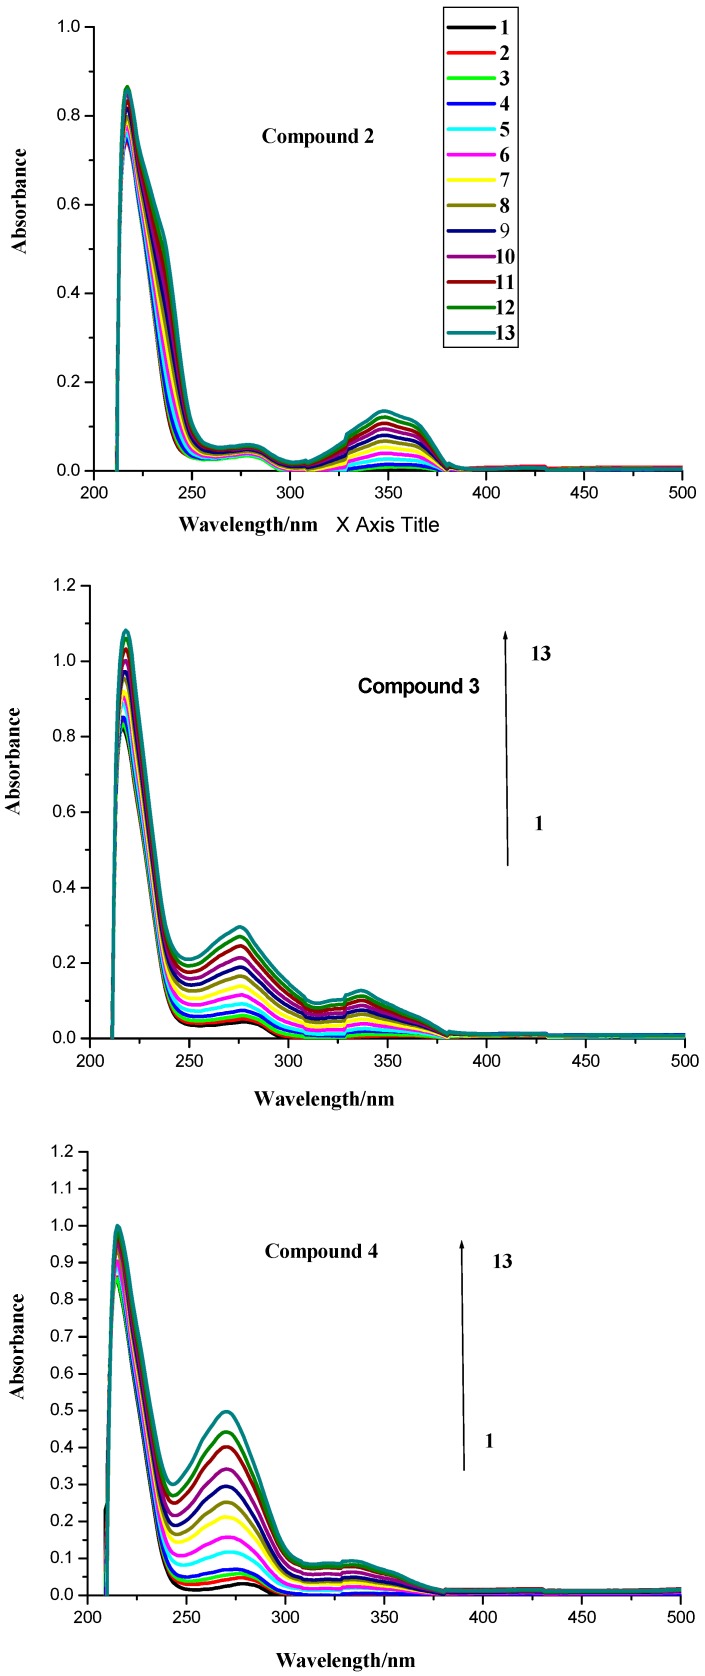
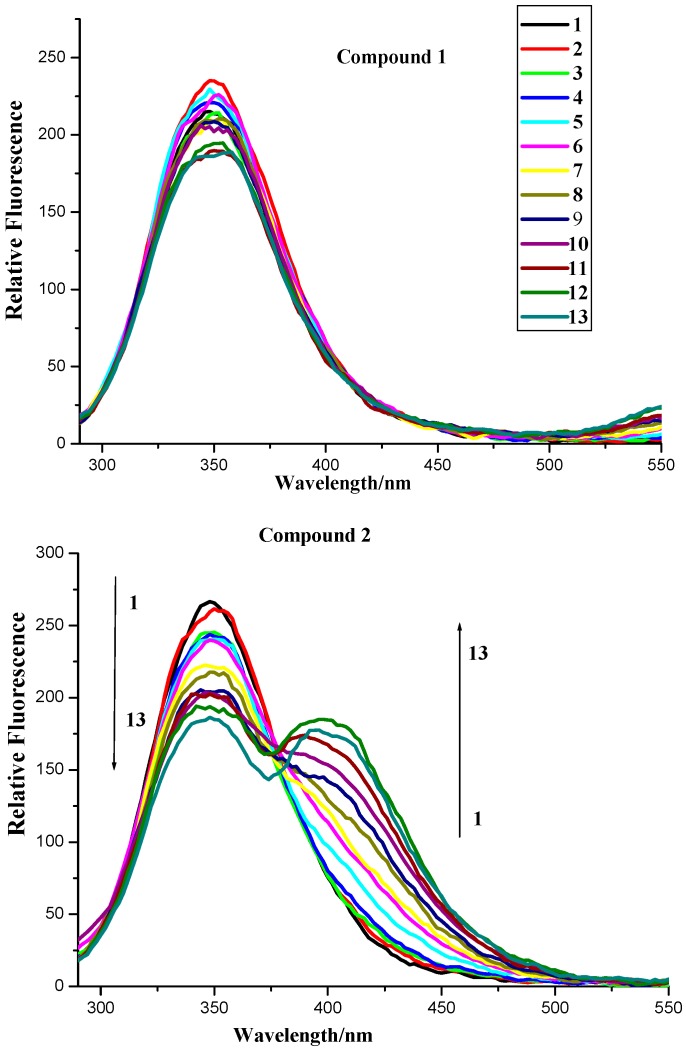
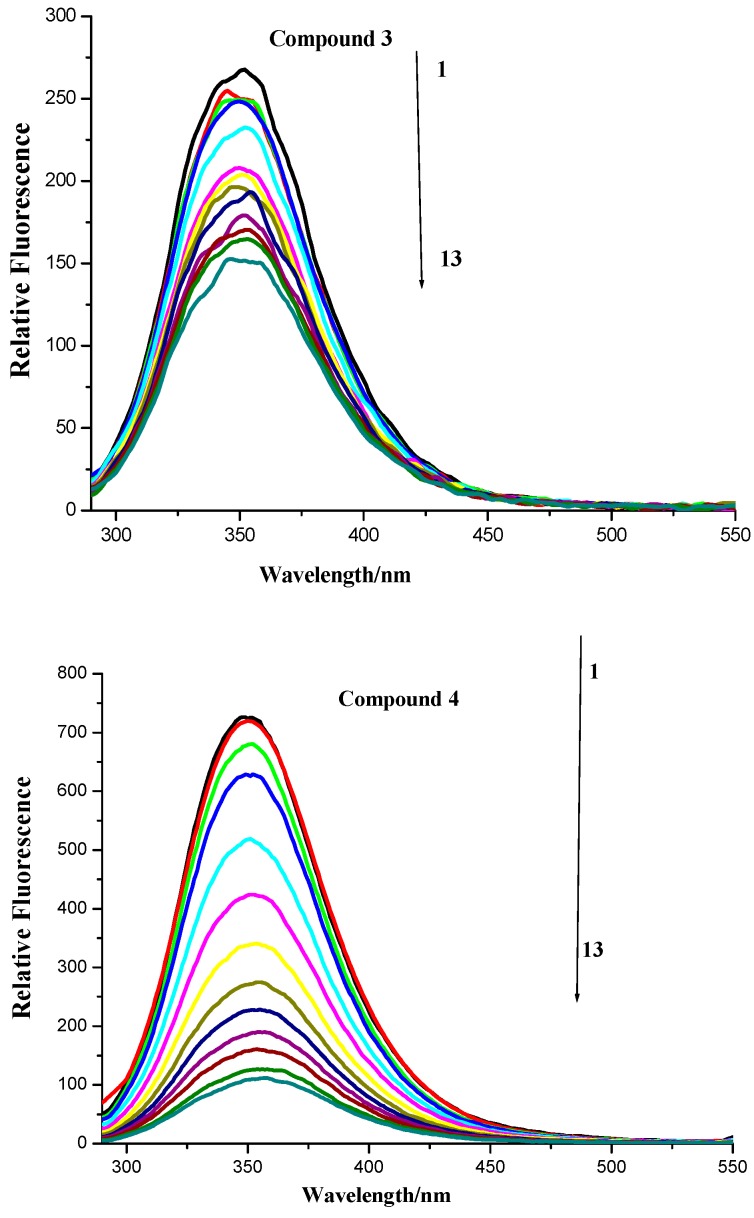
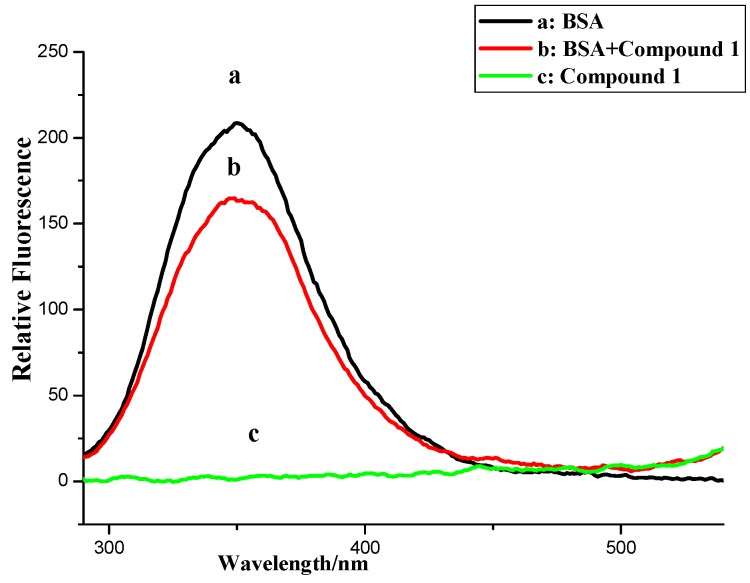
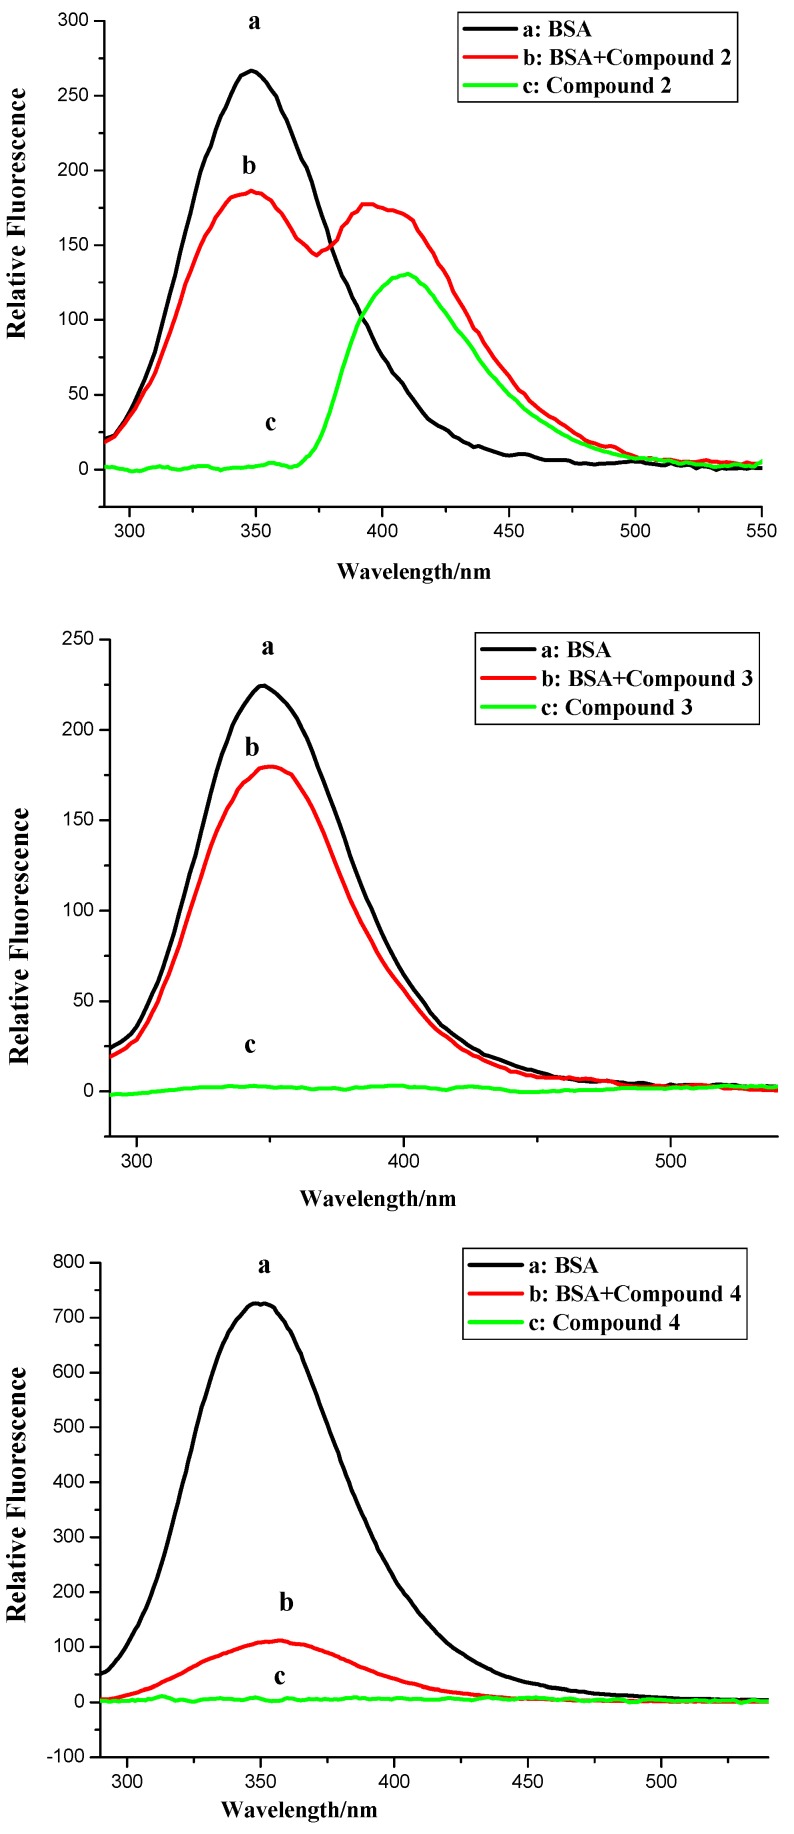
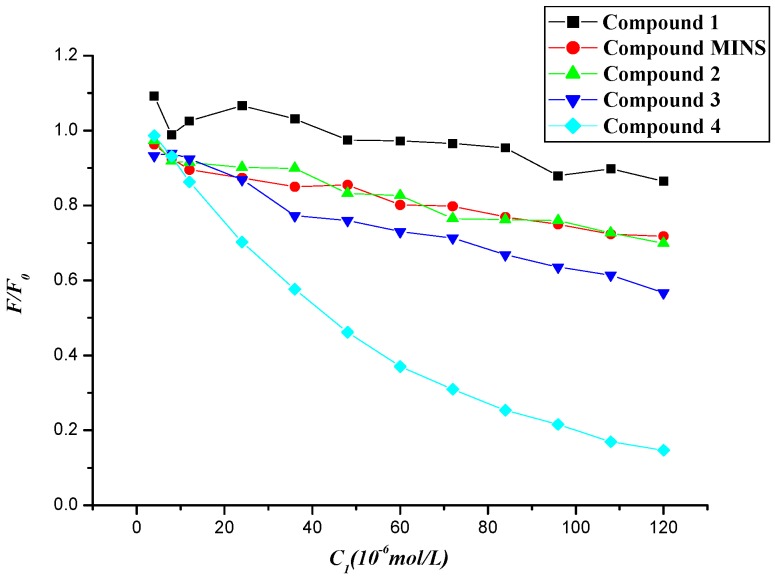
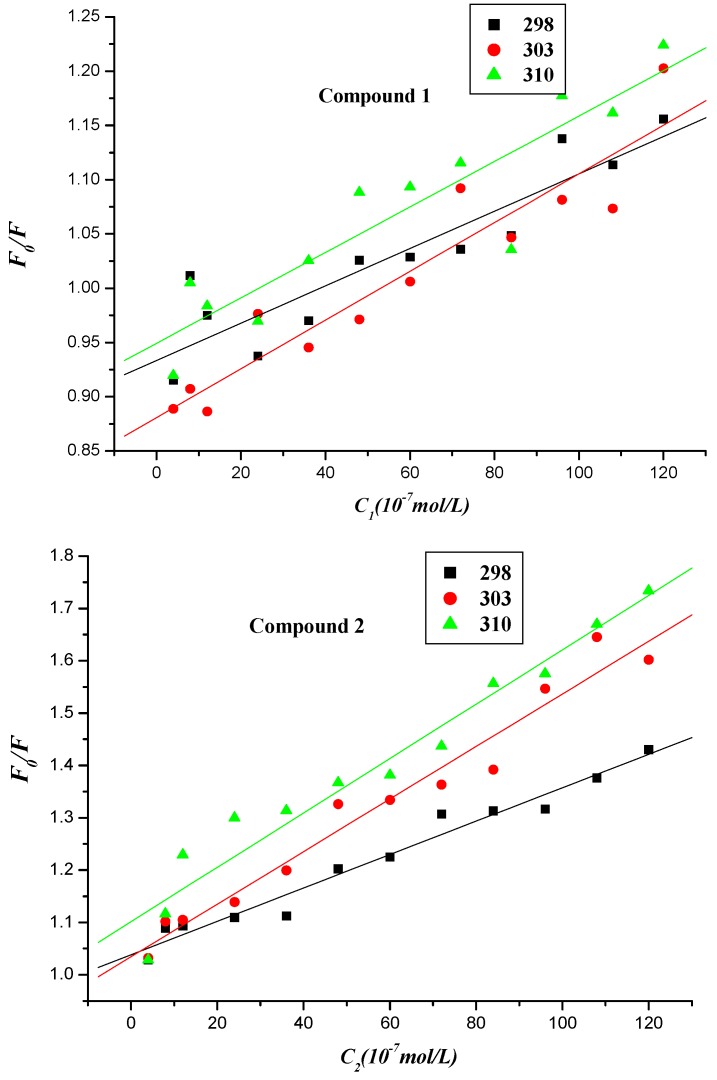
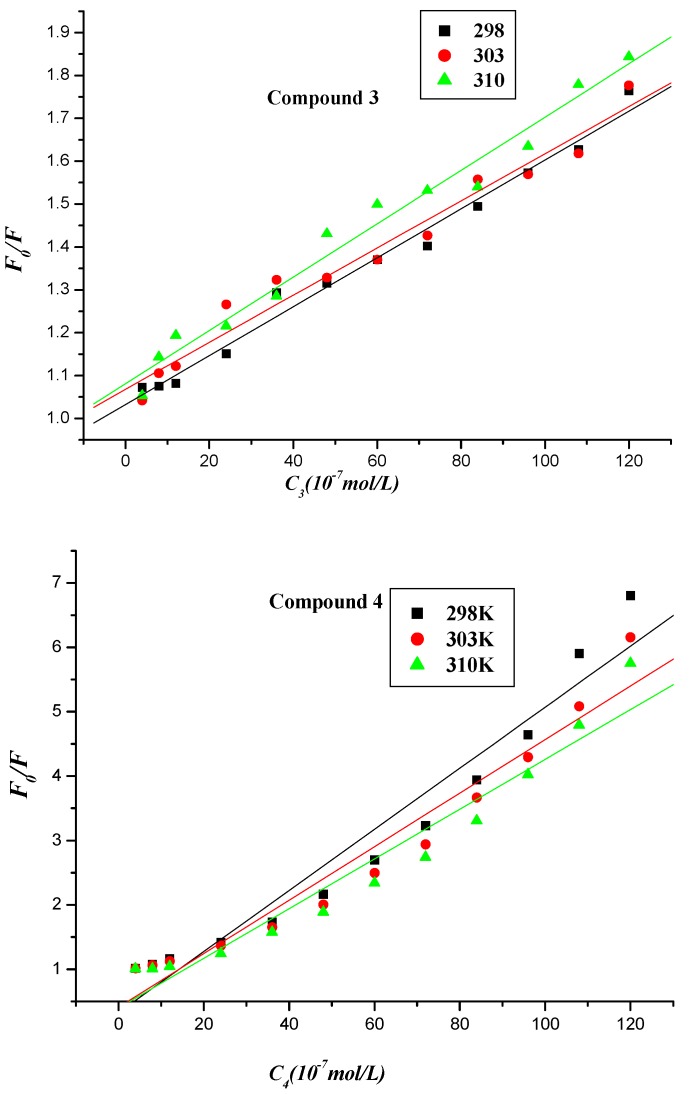
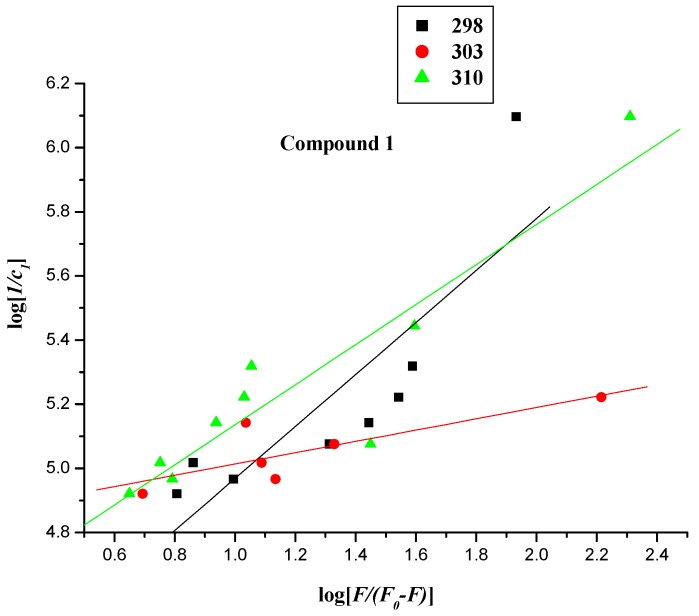
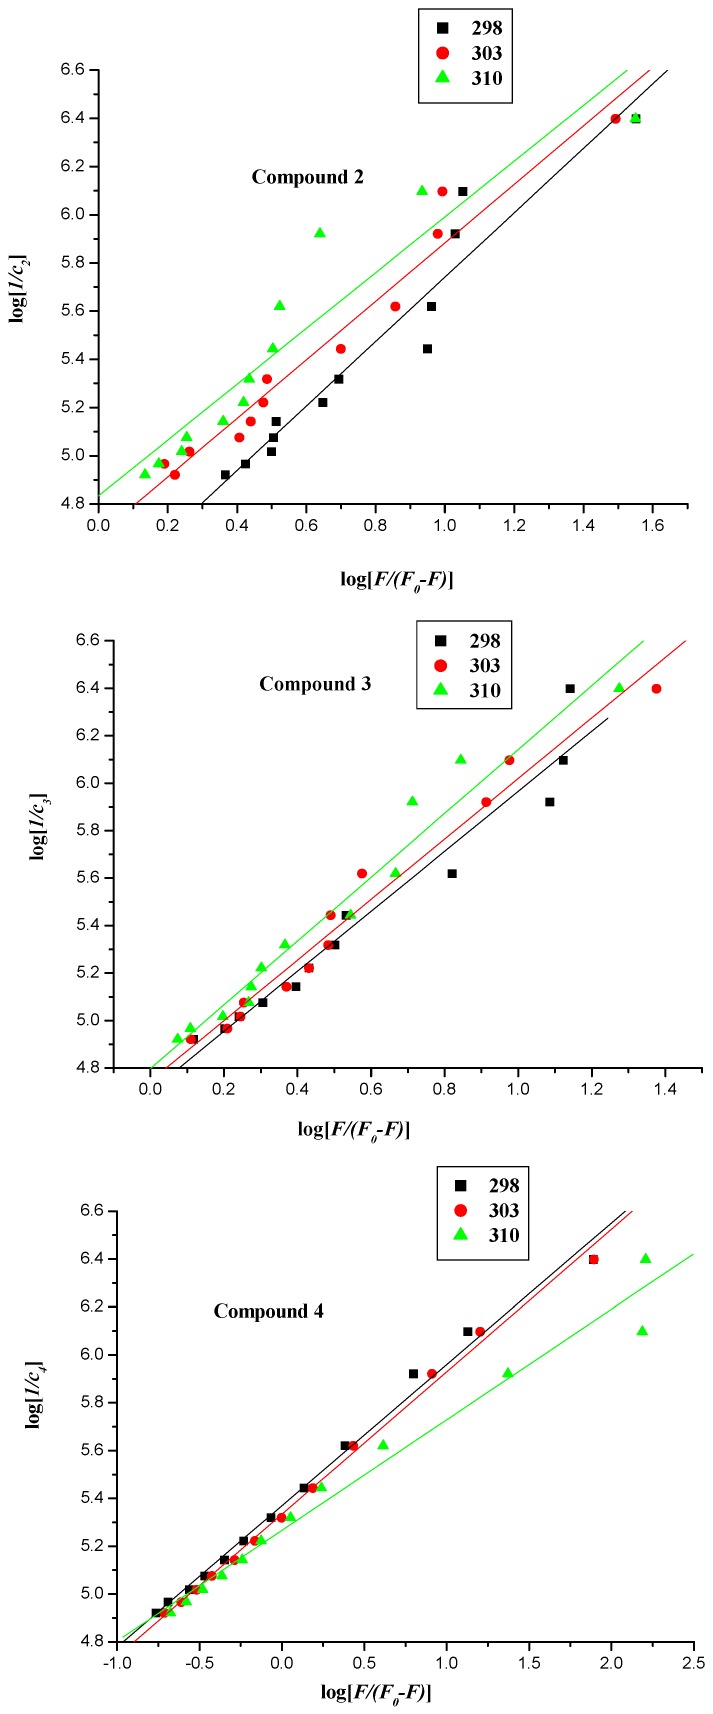
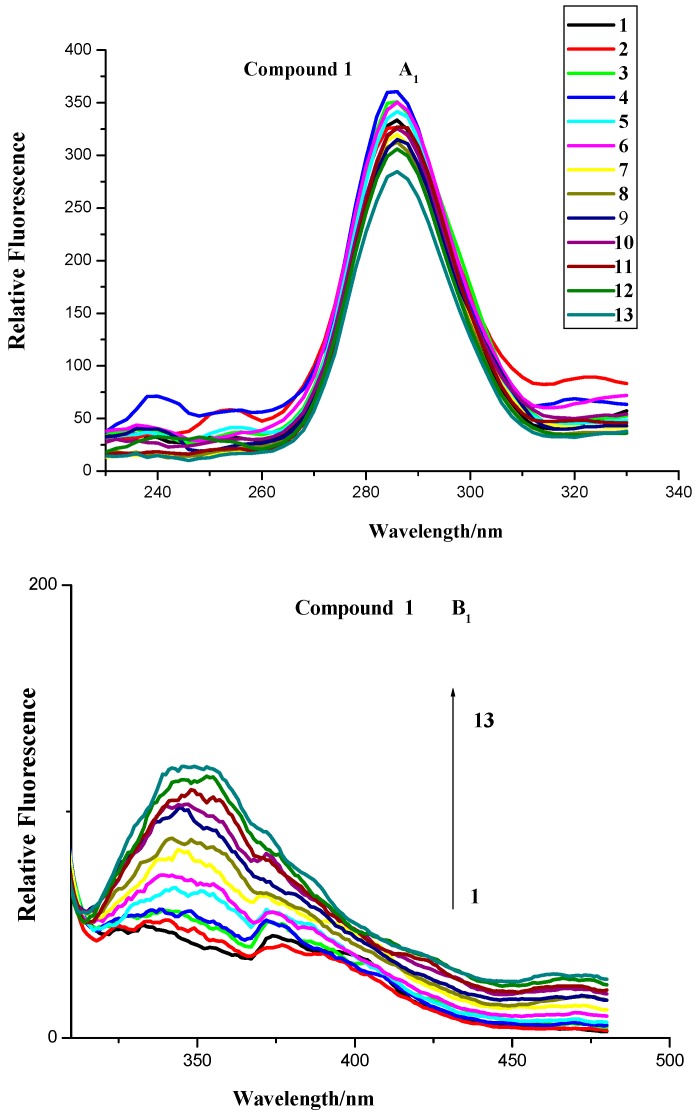
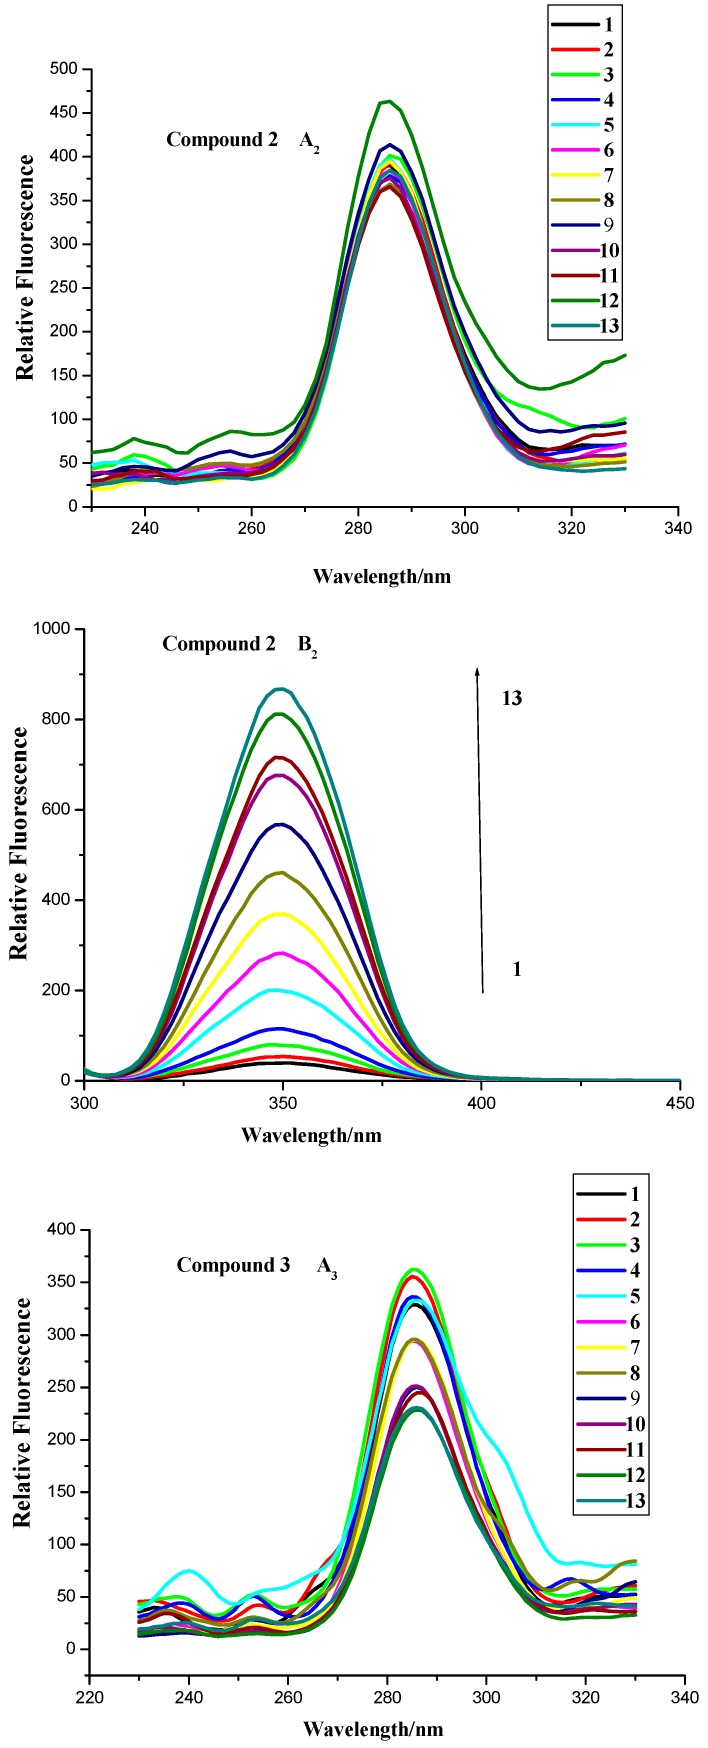
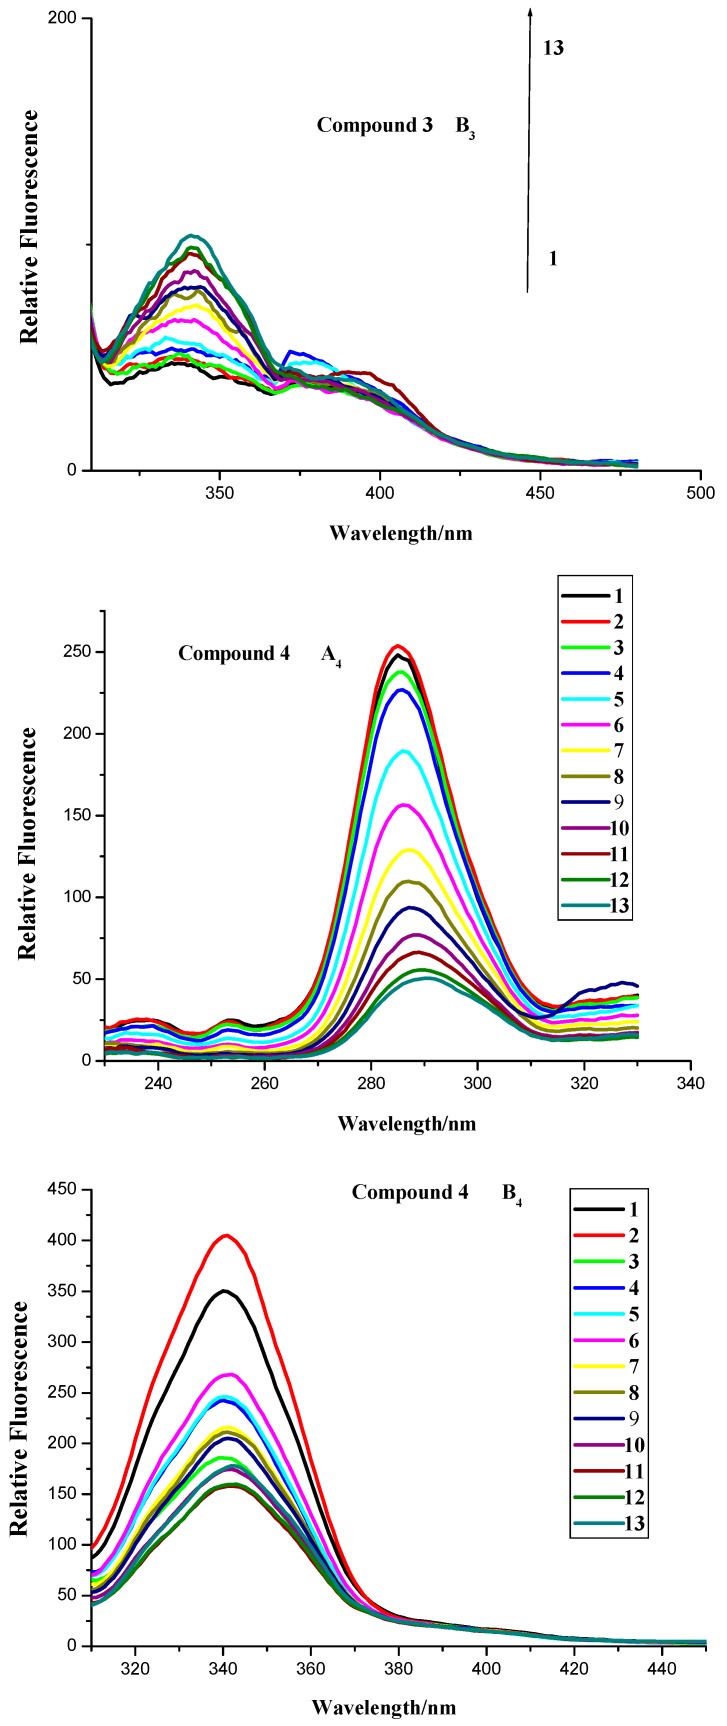
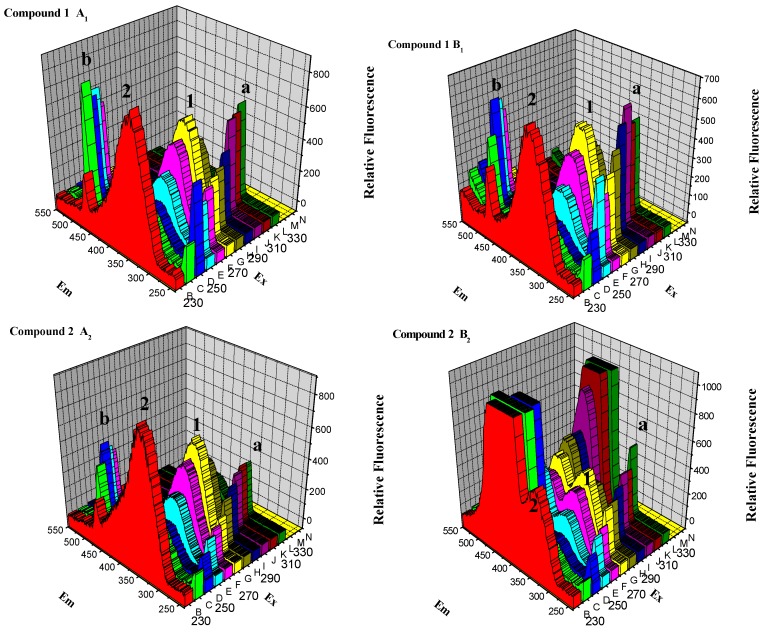
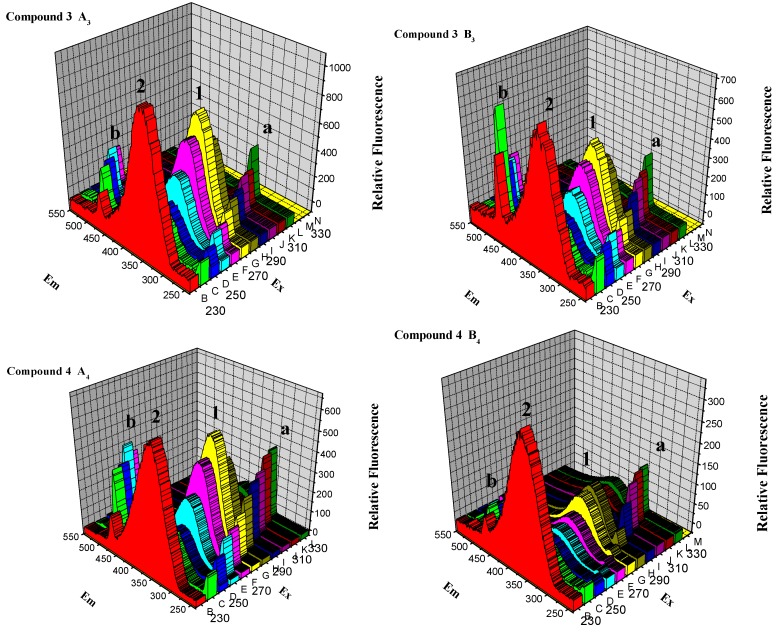
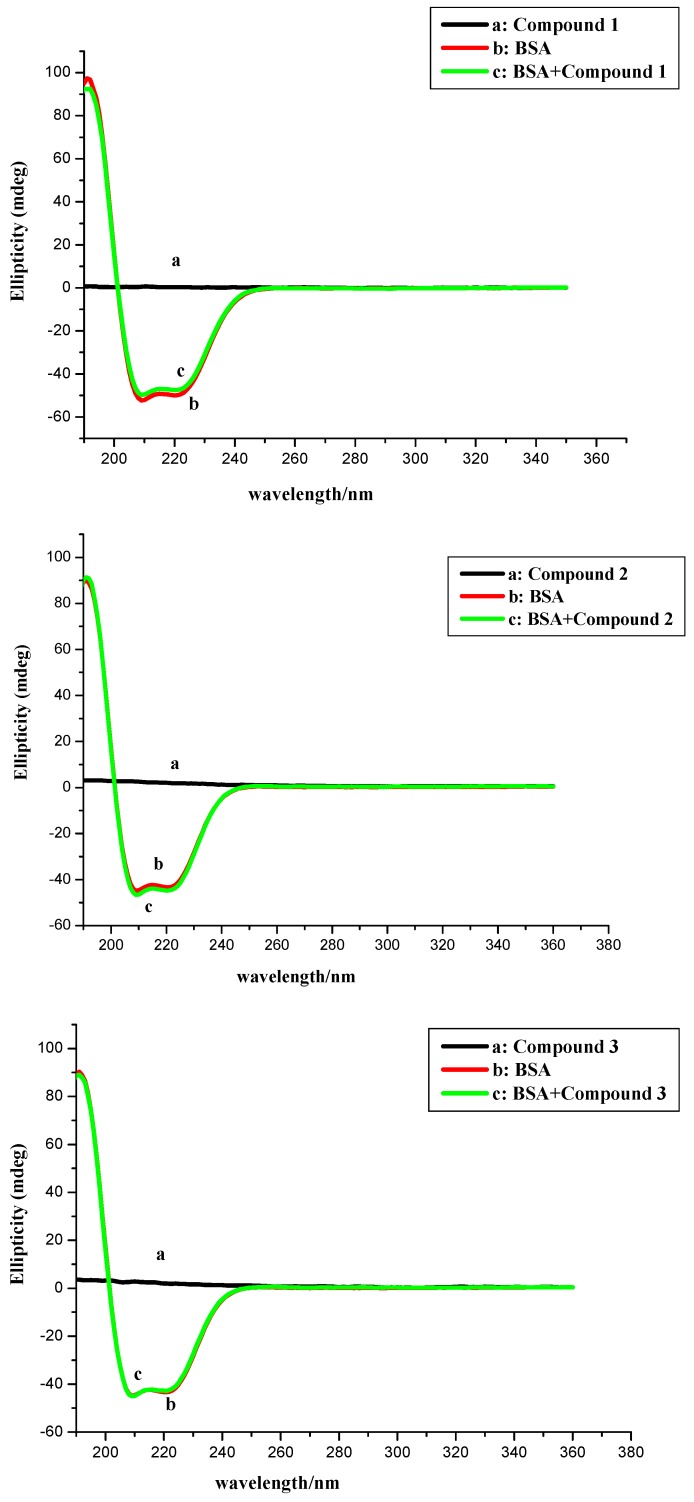
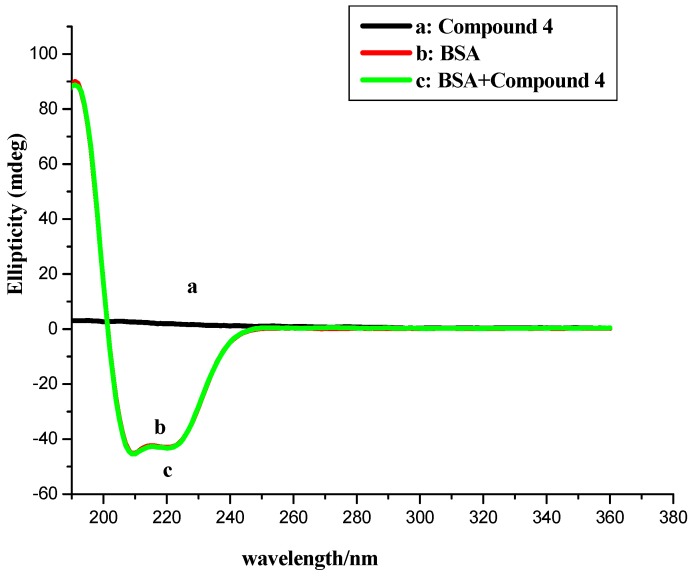
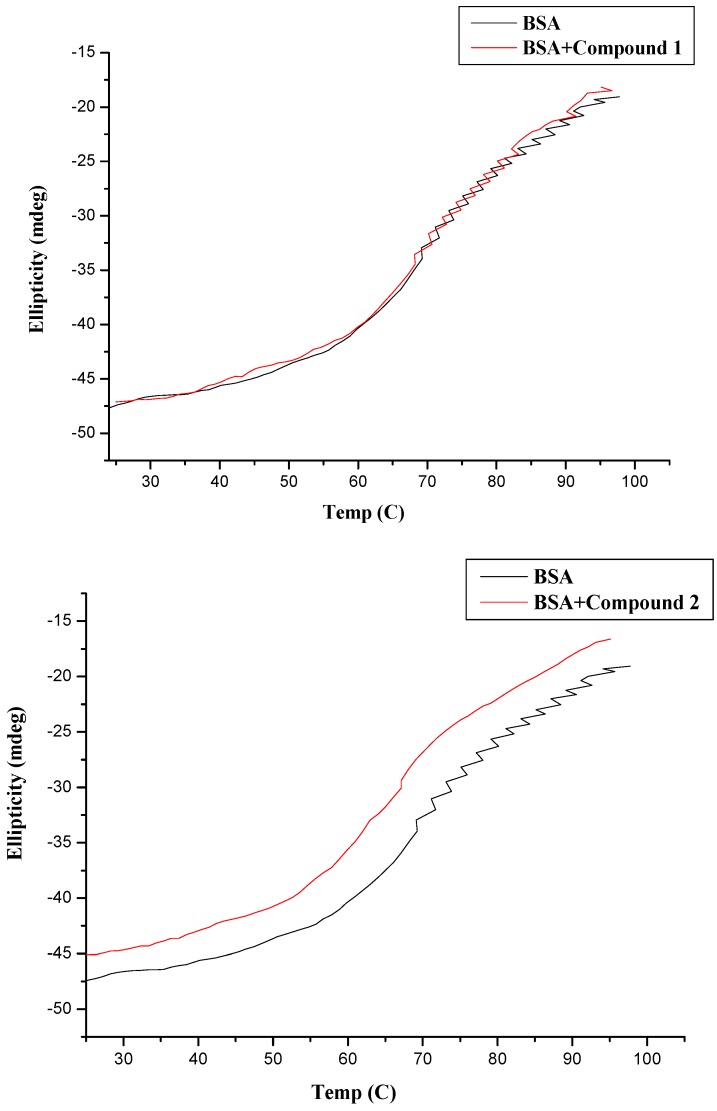
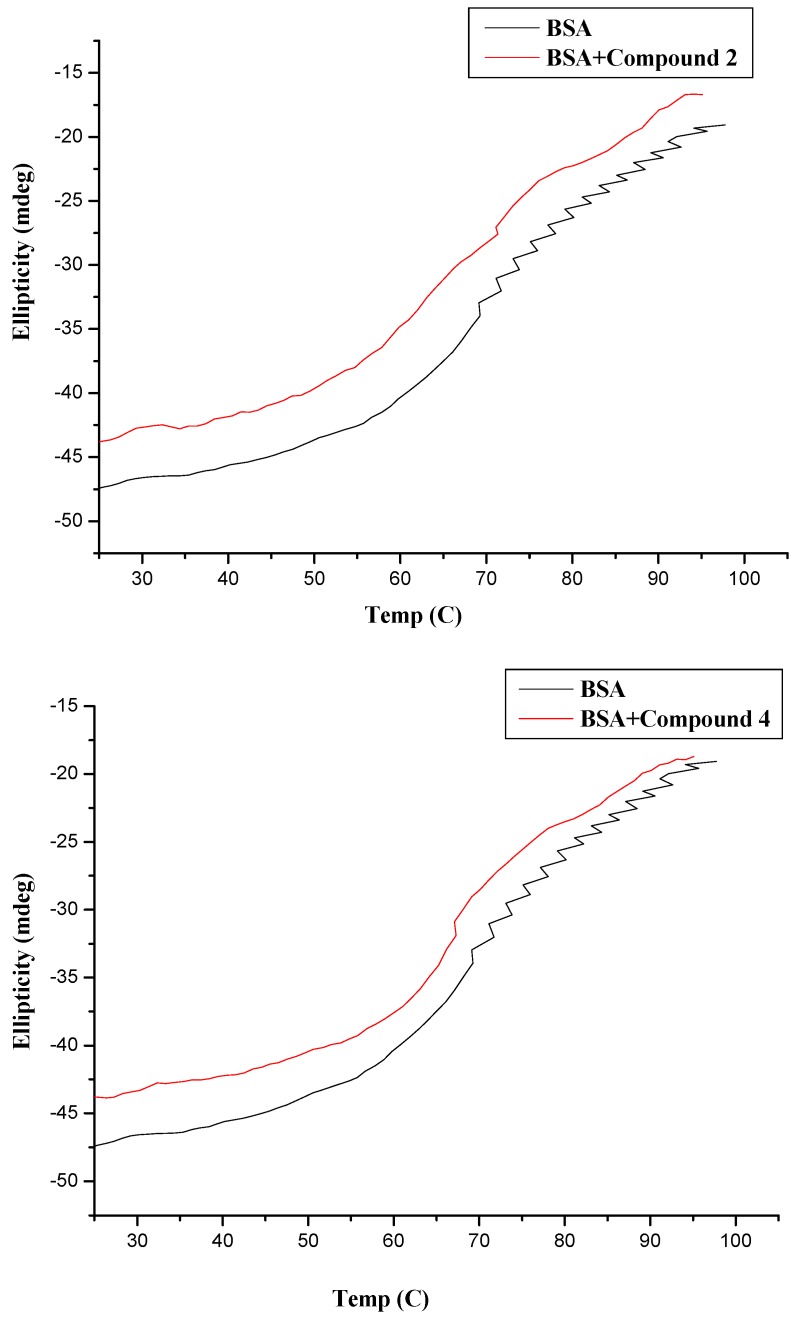
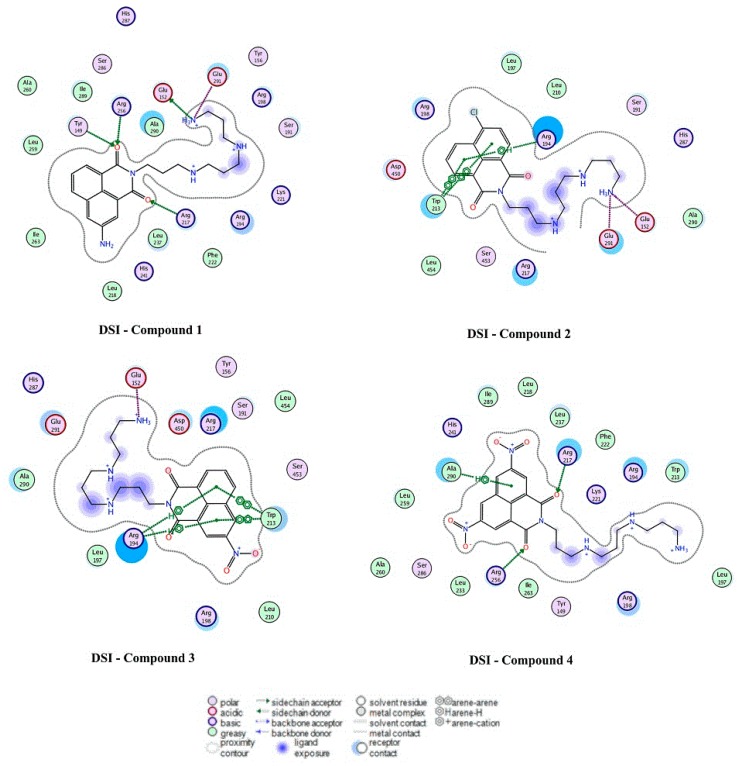
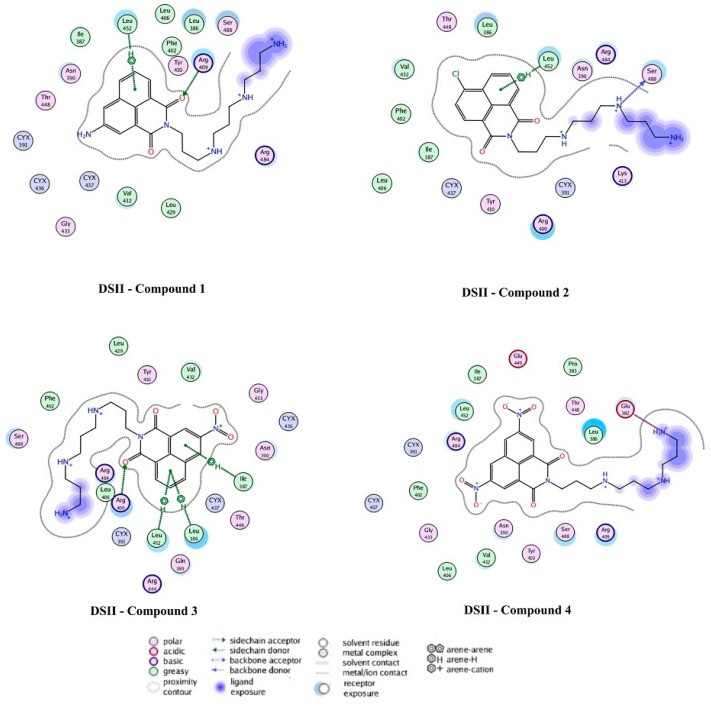
The effect of a naphthalimide pharmacophore coupled with diverse substituents on the interaction between naphthalimide-polyamine conjugates 1-4 and bovine serum albumin (BSA) was studied by UV absorption, fluorescence and circular dichroism (CD) spectroscopy under physiological conditions (pH = 7.4). The observed spectral quenching of BSA by the compounds indicated that they could bind to BSA. Furthermore, caloric fluorescent tests revealed that the quenching mechanisms of compounds 1-3 were basically static type, but that of compound 4 was closer to a classical type. The Ksv values at room temperature for compound-BSA complexes-1-BSA, 2-BSA, 3-BSA and 4-BSA were 1.438 × 10⁴, 3.190 × 10⁴, 5.700 × 10⁴ and 4.745 × 10⁵, respectively, compared with the value of MINS, 2.863 × 10⁴ at Ex = 280 nm. The obtained quenching constant, binding constant and thermodynamic parameter suggested that the binding between compounds 1-4 with BSA protein, significantly affected by the substituted groups on the naphthalene backbone, was formed by hydrogen bonds, and other principle forces mainly consisting of charged and hydrophobic interactions. Based on results from the analysis of synchronous three-dimensional fluorescence and CD spectra, we can conclude that the interaction between compounds 1-4 and BSA protein has little impact on the BSA conformation. Calculated results obtained from in silico molecular simulation showed that compound 1 did not prefer either enzymatic drug sites I or II over the other. However, DSII in BSA was more beneficial than DSI for the binding between compounds 2-4 and BSA protein. The binding between compounds 1-3 and BSA was hydrophobic in nature, compared with the electrostatic interaction between compound 4 and BSA.
Keywords: bovine serum albumin (BSA); conjugates; molecular docking; naphthalimide-polyamine; spectroscopic methods.
Conflict of interest statement
The authors declare no conflict of interest.
Figures
Similar articles
-
Spectroscopic study on the interaction between mononaphthalimide spermidine (MINS) and bovine serum albumin (BSA).J Photochem Photobiol B. 2015 Jan;142:103-9. doi: 10.1016/j.jphotobiol.2014.10.013. Epub 2014 Dec 6. J Photochem Photobiol B. 2015. PMID: 25528194
-
Spectroscopic study on the interaction between naphthalimide-polyamine conjugates and DNA.J Photochem Photobiol B. 2014 Sep 5;138:202-10. doi: 10.1016/j.jphotobiol.2014.06.001. Epub 2014 Jun 11. J Photochem Photobiol B. 2014. PMID: 24976624
-
Spectroscopic and molecular modeling methods to study the interaction between naphthalimide-polyamine conjugates and DNA.J Photochem Photobiol B. 2016 May;158:1-15. doi: 10.1016/j.jphotobiol.2016.01.017. Epub 2016 Feb 9. J Photochem Photobiol B. 2016. PMID: 26926663
-
Insight into the delivery channel and selectivity of multiple binding sites in bovine serum albumin towards naphthalimide-polyamine derivatives.Phys Chem Chem Phys. 2019 Apr 3;21(14):7429-7439. doi: 10.1039/c9cp00527g. Phys Chem Chem Phys. 2019. PMID: 30892331
-
Unlocking complexity through neutron scattering: Structure and dynamics of protein-polymer conjugates.Protein Sci. 2025 Jun;34(6):e70137. doi: 10.1002/pro.70137. Protein Sci. 2025. PMID: 40384628 Free PMC article. Review.
Cited by
-
Promising Bioactivity of Vitamin B1-Au Nanocluster: Structure, Enhanced Antioxidant Behavior, and Serum Protein Interaction.Antioxidants (Basel). 2023 Apr 3;12(4):874. doi: 10.3390/antiox12040874. Antioxidants (Basel). 2023. PMID: 37107249 Free PMC article.
-
Influence of Low Molecular Weight Salts on the Viscosity of Aqueous-Buffer Bovine Serum Albumin Solutions.Molecules. 2022 Feb 1;27(3):999. doi: 10.3390/molecules27030999. Molecules. 2022. PMID: 35164264 Free PMC article.
-
Synthetic nanoparticles of bovine serum albumin with entrapped salicylic acid.Nanotechnol Sci Appl. 2016 Dec 28;10:11-21. doi: 10.2147/NSA.S117018. eCollection 2017. Nanotechnol Sci Appl. 2016. PMID: 28096662 Free PMC article.
-
Novel vanadyl complexes synthesis, characterization and interactions with bovine serum albumin-effects on STZ- diabetes rats.Biometals. 2024 Apr;37(2):357-369. doi: 10.1007/s10534-023-00552-3. Epub 2023 Nov 10. Biometals. 2024. PMID: 37945804
-
A study of structure-activity relationship and anion-controlled quinolinyl Ag(I) complexes as antimicrobial and antioxidant agents as well as their interaction with macromolecules.Biometals. 2022 Apr;35(2):363-394. doi: 10.1007/s10534-022-00377-6. Epub 2022 Mar 11. Biometals. 2022. PMID: 35275314
References
-
- Sun Y., Wei S., Yin C., Liu L.S., Hu C.M., Zhao Y.Y., Ye Y.X., Hu X.Y., Fan J. Synthesis and spectroscopic characterization of 4-butoxyethoxy-N-octadecyl-1,8-naphthalimide as a new fluorescent probe for the determination of proteins. Bioorg. Med. Chem. Lett. 2011;21:3798–3804. doi: 10.1016/j.bmcl.2011.04.026. - DOI - PubMed
Publication types
MeSH terms
Substances
LinkOut - more resources
Full Text Sources
Other Literature Sources
