. 2015 Sep 10;16(9):21911-30.
doi: 10.3390/ijms160921911.

Ghrelin Attenuates Liver Fibrosis through Regulation of TGF-β1 Expression and Autophagy

Affiliations

Ghrelin Attenuates Liver Fibrosis through Regulation of TGF-β1 Expression and Autophagy

Yuqing Mao et al. Int J Mol Sci. .

Abstract

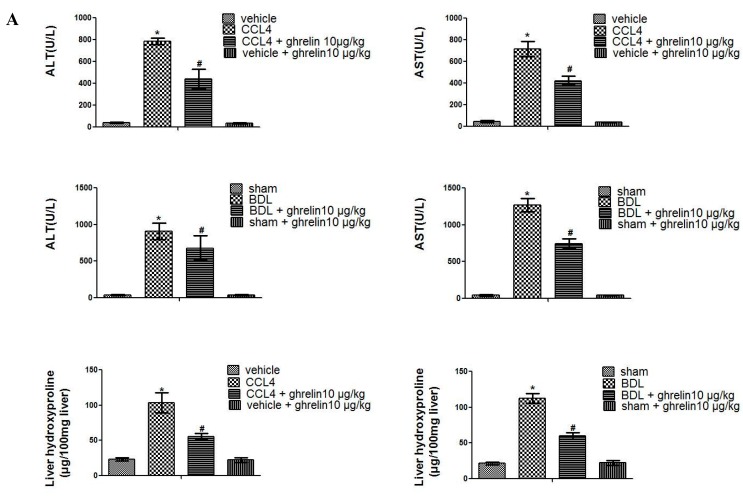
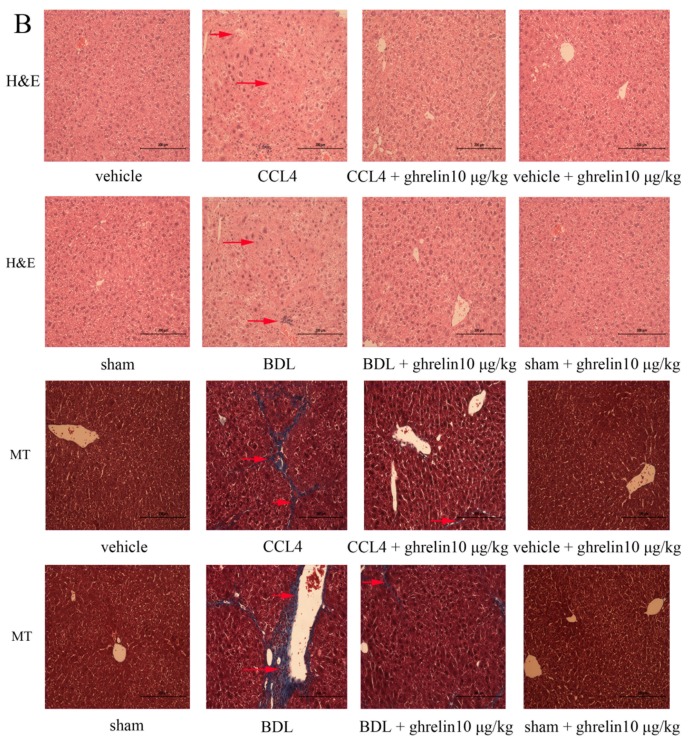
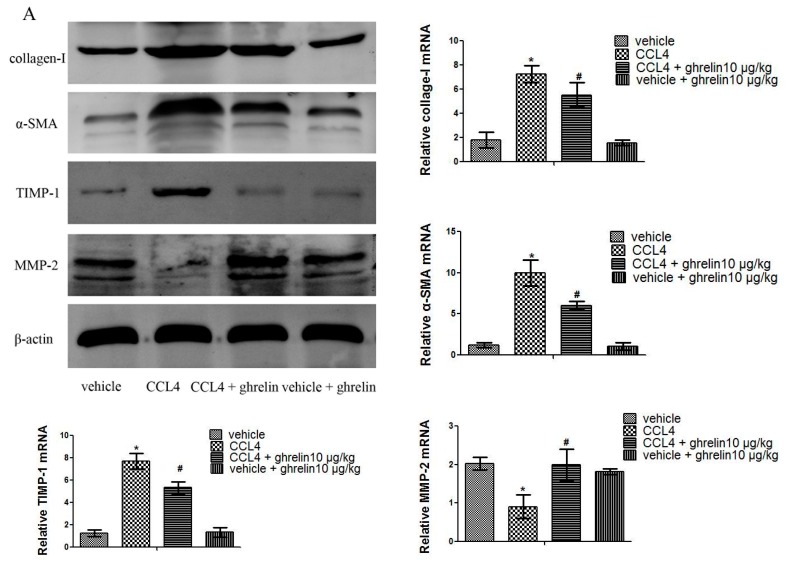
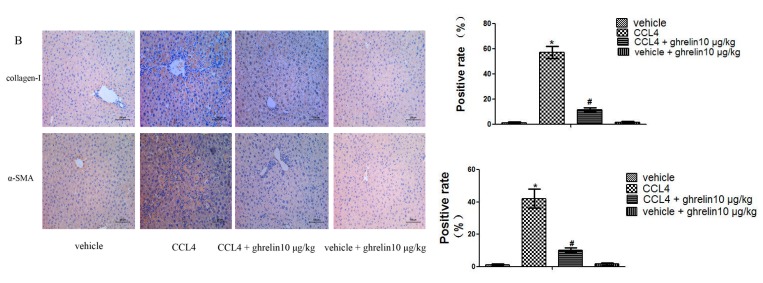
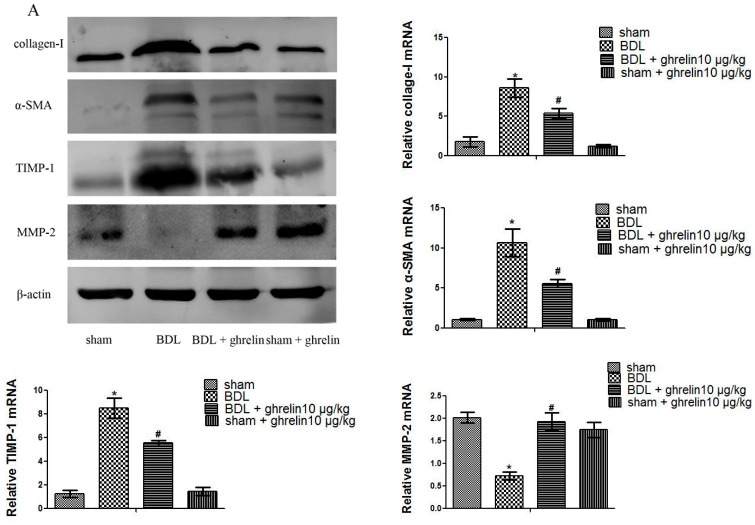
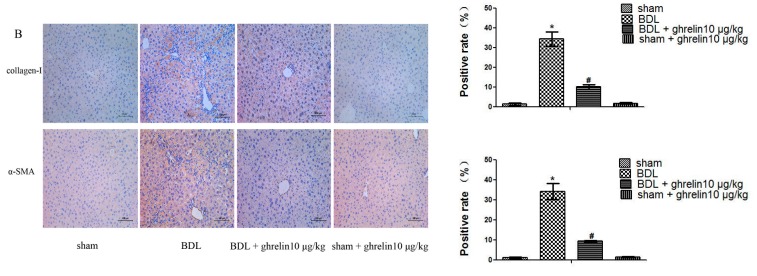
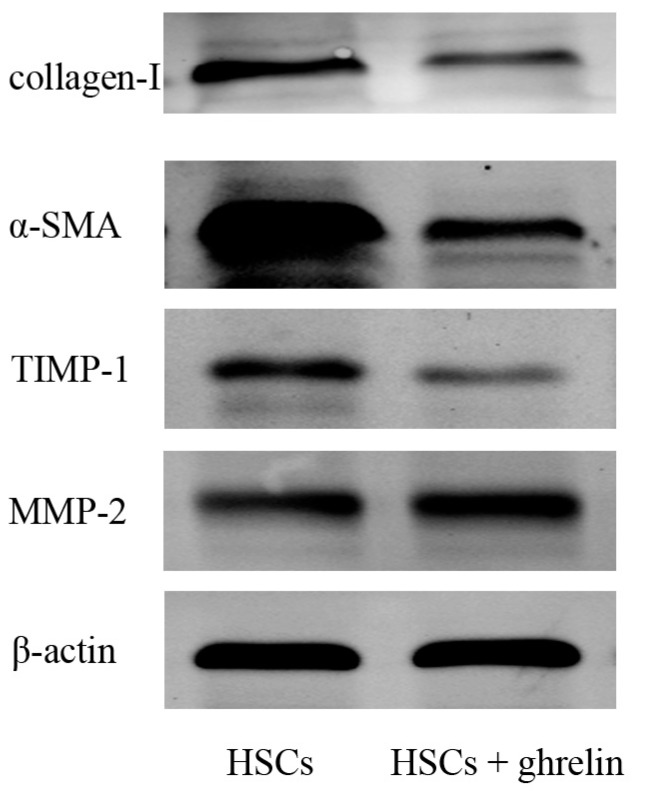
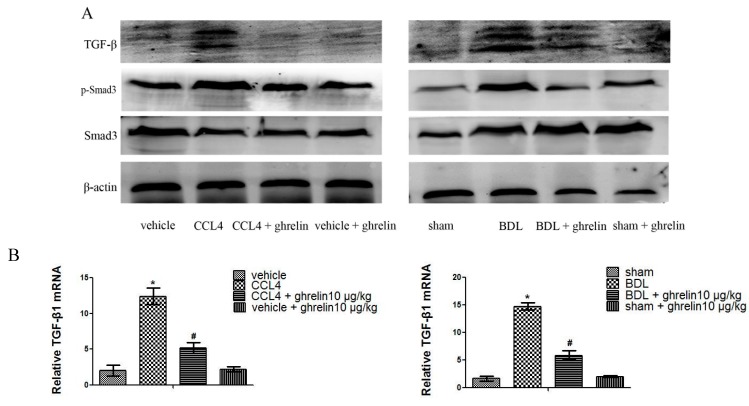
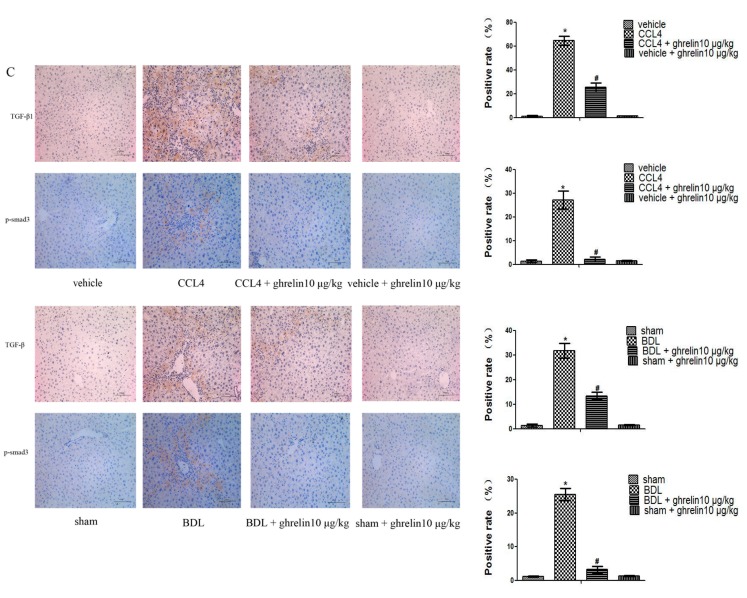
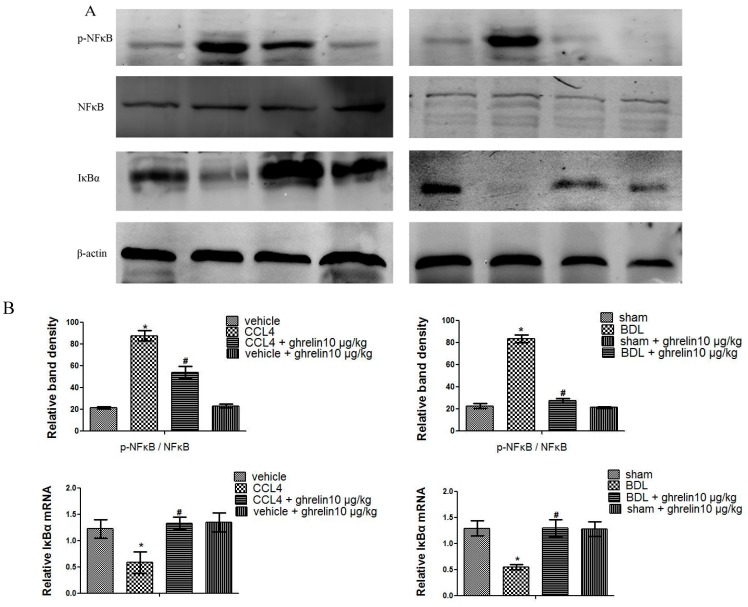
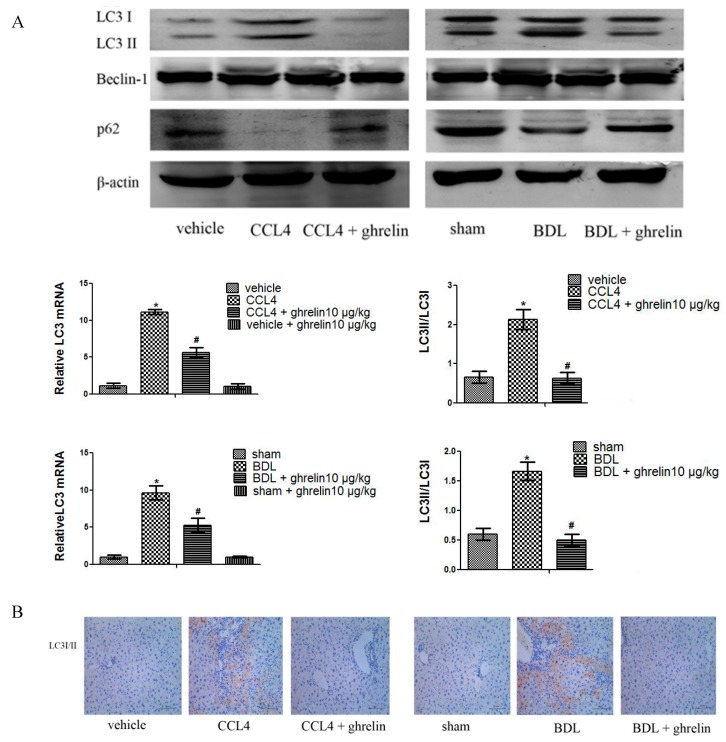
Ghrelin is a stomach-derived growth hormone secretagogue that promotes various physiological effects, including energy metabolism and amelioration of inflammation. The purpose of this study was to investigate the protective mechanism of ghrelin against liver fibrosis. Liver fibrosis was induced in C57BL/6 mice by intraperitoneal injection of CCl₄ (2.0 mL/kg of 10% CCl₄ v/v solution in peanut oil) two times per week for eight weeks. Ghrelin (10 μg/kg) was intraperitoneally injected two times per week for eight weeks. A second murine liver fibrosis model was induced by bile duct ligation (BDL) and concurrent ghrelin administration for four weeks. Hematoxylin eosin (H&E), and Masson's trichrome were used to detect pathological changes to liver tissue. Western blotting was used to detect protein levels of transforming growth factor (TGF)-β1, phosphorylated Smad3 (p-Smad3), I-collage, α-smooth muscle actin (α-SMA), matrix metalloproteinases (MMPs) 2, tissue inhibitor of matrix metalloproteinases (TIMPs) 1, phosphorylated NF-κB (p-NF-κB), and microtubule-associated protein light chain 3 (LC3). In addition, qRT-PCR was used to detect mRNA levels of TGF-β1, I-collage, α-SMA, MMP2, TIMP1 and LC3, while levels of TGF-β1, p-Smad3, I-collage, α-SMA, and LC3 were detected immunohistochemically. Levels of aspartate aminotransferase and alanine aminotransferase were significantly decreased by ghrelin treatment. Ghrelin administration also significantly reduced the extent of pathological changes in both murine liver fibrosis models. Expression levels of I-collage and α-SMA in both models were clearly reduced by ghrelin administration. Furthermore, ghrelin treatment decreased protein expression of TGF-β1 and p-Smad3. The protein levels of NF-κB and LC3 were increased in the CCl₄- and BDL-treatment groups but were significantly reduced following ghrelin treatment. In addition, ghrelin inhibited extracellular matrix formation by decreasing NF-κB expression and maintaining the balance between MMP2 and TIMP1. Our results demonstrated that ghrelin attenuates liver fibrosis via inhibition of the TGF-β1/Smad3 and NF-κB signaling pathways, as well as autophagy suppression.

Keywords: CCl4; NF-κB; TGF-β1-Smad; autophagy; bile duct ligation; fibrosis; ghrelin; hepatic stellate cells.


Figures

Figure 1
Figure 1
Effect of ghrelin on CCl4- and BDL-induced liver fibrosis. (A) Ghrelin decreased the levels of ALT, AST, and hydroxyproline. Data are expressed as the mean ± SD (n = 7, * p < 0.05 for CCl4 or BDL group vs. the vehicle or sham group, # p < 0.05 for CCl4 + ghrelin or BDL + ghrelin group vs. the CCl4 or BDL groups); and (B) Ghrelin ameliorated pathological changes to the liver, as demonstrated by H & E and Masson’s trichrome (MT) staining (original magnification: 200×). Red arrows indicate damaged liver tissue and fiber cords. BDL: bile duct ligation; ALT: alanine transaminase; AST: aspartate transaminase; H & E: hematoxylin and eosin; MT: Masson’s trichrome. The scale bar of each figure is 200 μm, and the magnification is 200×.
Figure 1
Figure 1
Effect of ghrelin on CCl4- and BDL-induced liver fibrosis. (A) Ghrelin decreased the levels of ALT, AST, and hydroxyproline. Data are expressed as the mean ± SD (n = 7, * p < 0.05 for CCl4 or BDL group vs. the vehicle or sham group, # p < 0.05 for CCl4 + ghrelin or BDL + ghrelin group vs. the CCl4 or BDL groups); and (B) Ghrelin ameliorated pathological changes to the liver, as demonstrated by H & E and Masson’s trichrome (MT) staining (original magnification: 200×). Red arrows indicate damaged liver tissue and fiber cords. BDL: bile duct ligation; ALT: alanine transaminase; AST: aspartate transaminase; H & E: hematoxylin and eosin; MT: Masson’s trichrome. The scale bar of each figure is 200 μm, and the magnification is 200×.
Figure 2
Figure 2
Ghrelin inhibited activation of HSCs and expression of MMP2 and TIMP1 in CCl4-induced liver fibrosis. (A) Results of Western blot and real-time PCR analyses of collagen I, α-SMA, TIMP1, and MMP2 in the CCl4 group; and (B) Immunohistochemical staining (200×) showed increased expression of collagen I and α-SMA proteins in CCl4-induced fibrotic liver tissues. The positive rate was analyzed with Image-Pro Plus 6.0. Data are expressed as the mean ± SD (n = 7, * p < 0.05 for CCl4 vs. vehicle group, # p < 0.05 for ghrelin + CCl4 vs. CCl4 group). HSCs: hepatic stellate cells; MMP: matrix metalloproteinase; TIMP: tissue inhibitor of matrix metalloproteinase; α-SMA: α-smooth muscle actin. The scale bar of each figure is 200 μm, and the magnification is 200×.
Figure 2
Figure 2
Ghrelin inhibited activation of HSCs and expression of MMP2 and TIMP1 in CCl4-induced liver fibrosis. (A) Results of Western blot and real-time PCR analyses of collagen I, α-SMA, TIMP1, and MMP2 in the CCl4 group; and (B) Immunohistochemical staining (200×) showed increased expression of collagen I and α-SMA proteins in CCl4-induced fibrotic liver tissues. The positive rate was analyzed with Image-Pro Plus 6.0. Data are expressed as the mean ± SD (n = 7, * p < 0.05 for CCl4 vs. vehicle group, # p < 0.05 for ghrelin + CCl4 vs. CCl4 group). HSCs: hepatic stellate cells; MMP: matrix metalloproteinase; TIMP: tissue inhibitor of matrix metalloproteinase; α-SMA: α-smooth muscle actin. The scale bar of each figure is 200 μm, and the magnification is 200×.
Figure 3
Figure 3
Ghrelin inhibited activation of HSCs and expression of MMP2 and TIMP1 in BDL-induced liver fibrosis. (A) Western blot and real-time PCR analyses of collagen I, α-SMA, TIMP1, and MMP2 in the CCl4 group; and (B) Immunohistochemical staining (200×) of collagen I and α-SMA protein in BDL-induced fibrotic liver tissues. The positive rate was analyzed with Image-Pro Plus 6.0. Data are expressed as the mean ± SD (n = 7, * p < 0.05 for the BDL vs. sham group, # p < 0.05 for the ghrelin + BDL vs. BDL group). The scale bar of each figure is 200 μm, and the magnification is 200×.
Figure 3
Figure 3
Ghrelin inhibited activation of HSCs and expression of MMP2 and TIMP1 in BDL-induced liver fibrosis. (A) Western blot and real-time PCR analyses of collagen I, α-SMA, TIMP1, and MMP2 in the CCl4 group; and (B) Immunohistochemical staining (200×) of collagen I and α-SMA protein in BDL-induced fibrotic liver tissues. The positive rate was analyzed with Image-Pro Plus 6.0. Data are expressed as the mean ± SD (n = 7, * p < 0.05 for the BDL vs. sham group, # p < 0.05 for the ghrelin + BDL vs. BDL group). The scale bar of each figure is 200 μm, and the magnification is 200×.
Figure 4
Figure 4
Ghrelin inhibited activation of HSCs and expression of MMP2 and TIMP1. Western blot analysis of collagen I, α-SMA, TIMP1 and MMP2.
Figure 5
Figure 5
Ghrelin regulates the TGF-β1/Smad3 signaling pathway. (A) Western blot analysis of TGF-β1, p-Smad3, and Smad3 in the CCl4 and BDL fibrotic mice models; (B) Real-time PCR analysis of TGF-β1 is shown and (C) Immunohistochemical staining (200×) of TGF-β1and p-Smad3 in both CCl4 and BDL-induced fibrotic liver tissues. The positive rate was analyzed with Image-Pro Plus 6.0. (n = 7, * p < 0.05 for the CCl4 or BDL group vs. the vehicle or sham group, # p < 0.05 for the CCl4 or BDL + ghrelin group vs. the CCl4 or BDL group). The scale bar of each figure is 200 μm, and the magnification is 200×.
Figure 5
Figure 5
Ghrelin regulates the TGF-β1/Smad3 signaling pathway. (A) Western blot analysis of TGF-β1, p-Smad3, and Smad3 in the CCl4 and BDL fibrotic mice models; (B) Real-time PCR analysis of TGF-β1 is shown and (C) Immunohistochemical staining (200×) of TGF-β1and p-Smad3 in both CCl4 and BDL-induced fibrotic liver tissues. The positive rate was analyzed with Image-Pro Plus 6.0. (n = 7, * p < 0.05 for the CCl4 or BDL group vs. the vehicle or sham group, # p < 0.05 for the CCl4 or BDL + ghrelin group vs. the CCl4 or BDL group). The scale bar of each figure is 200 μm, and the magnification is 200×.
Figure 6
Figure 6
Ghrelin may be associated with NF-κB signaling pathway inhibition. (A) Western blot analysis of p-NF-κB, NF-κB, and IκBα in CCl4- and BDL-induced fibrotic liver tissues; and (B) Relative band density of p-NF-κB/NF-κB and real-time PCR evaluation of IκBα in both CCl4- and BDL-induced fibrotic liver tissues. (n = 7, * p < 0.05 for the CCl4 or BDL group vs. the vehicle or sham group, # p < 0.05 for the ghrelin + CCl4 or BDL group vs. the CCl4 or BDL group).
Figure 7
Figure 7
Ghrelin inhibited the process of autophagy in liver fibrosis. (A) Western blot analyses of LC3I/II, Beclin-1 and p62 in both the CCl4- and BDL-induced fibrotic liver tissues. Real-time PCR shows gene expression of LC3 (n = 7, * p < 0.05 for the CCl4 or BDL group vs. the vehicle or sham group, # p < 0.05 for the ghrelin + CCl4 or BDL group vs. the CCl4 or BDL group); and (B) Immunohistochemical staining (200×) of LC3I/II in the CCl4- and BDL-induced fibrotic liver tissues. The scale bar of each figure is 200 μm, and the magnification is 200×.

Similar articles

Cited by

References

    1. Dranoff J.A., Wells R.G. Portal fibroblasts: Underappreciated mediators of biliary fibrosis. Hepatology. 2010;5:1438–4144. doi: 10.1002/hep.23405. - DOI - PMC - PubMed
    1. Friedman S.L. The cellular basis of hepatic fibrosis—Mechanisms and treatment strategies. N. Engl. J. Med. 1993;328:1828–1835. - PubMed
    1. Sherman M., Klein A. AASLD single-topic research conference on hepatocellular carcinoma: Conference proceedings. Hepatology. 2004;40:1465–1473. doi: 10.1002/hep.20528. - DOI - PubMed
    1. Lim Y.S., Kim W.R. The global impact of hepatic fibrosis and end-stage liver disease. Clin. Liver Dis. 2008;12:733–746. doi: 10.1016/j.cld.2008.07.007. - DOI - PubMed
    1. De Minicis S., Seki E., Uchinami H., Kluwe J., Zhang Y., Brenner D.A., Schwabe R.F. Gene expression profiles during hepatic stellate cell activation in culture and in vivo. Gastroenterology. 2007;132:1937–1946. doi: 10.1053/j.gastro.2007.02.033. - DOI - PubMed

Publication types

MeSH terms