

Fall-related injuries among Canadian seniors, 2005-2013: an analysis of the Canadian Community Health Survey
- PMID: 26378768
- PMCID: PMC4910457
- DOI: 10.24095/hpcdp.35.7.01
Fall-related injuries among Canadian seniors, 2005-2013: an analysis of the Canadian Community Health Survey
Abstract
Introduction: We describe the epidemiology and trends of fall-related injuries among Canadian seniors aged 65 years and older by sex and age, as well as the circumstances and consequences of their injuries.
Methods: We analyzed nationally representative data from the 2005, 2009/2010 and 2013 samples of the Canadian Community Health Survey to calculate the number and rates of fall-related injuries for each survey year. Where possible, we combined data from two or more samples to estimate the proportion of fall-related injuries by type of injury, part of body injured, type of activity and type of treatment.
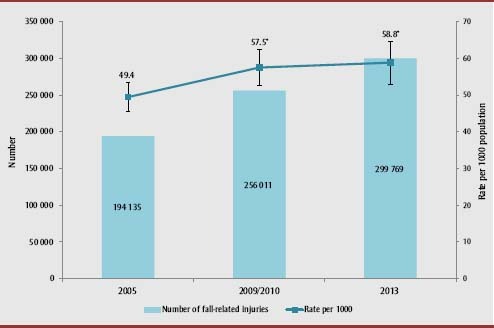
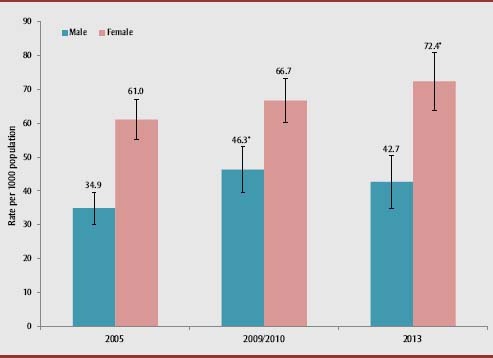
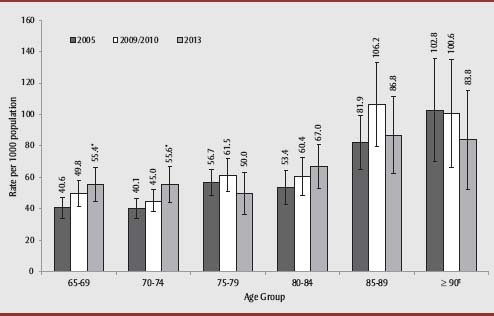
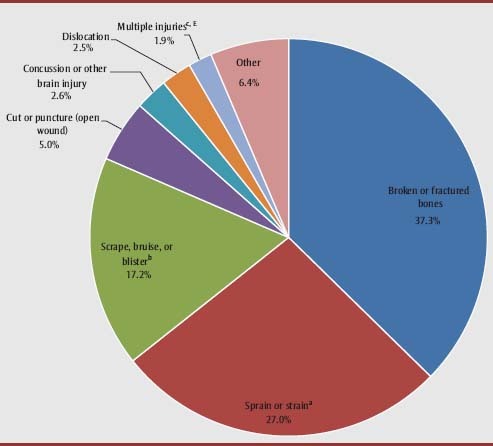
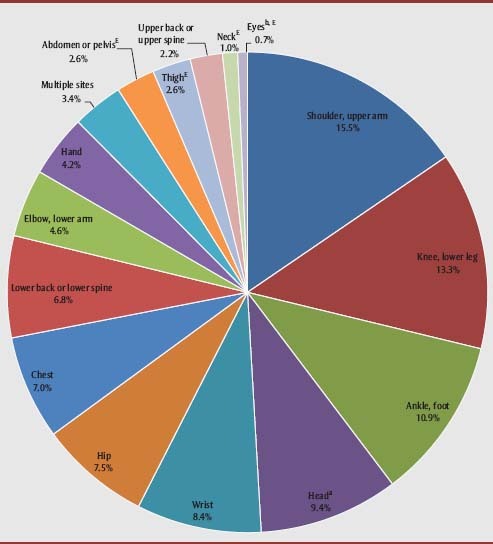
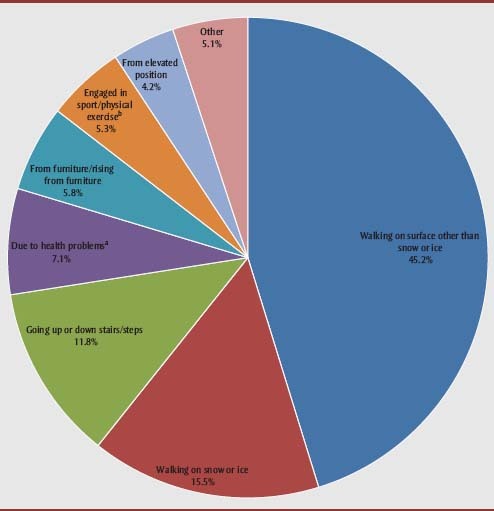
Results: The rate of fall-related injuries among seniors increased from 49.4 to 58.8 per 1000 population between 2005 and 2013, during which the number of fall-related injuries increased by 54% overall. Women had consistently higher rates than men across all survey years, while rates increased with advancing age. The upward trend in fall-related injury rates was more prominent among women and younger age groups. The most common type of injury was broken or fractured bones (37%), and the shoulder or upper arm (16%) was the most commonly injured body part. Many fall-related injuries occurred while walking on a surface other than snow or ice (45%). Over 70% of seniors seeking treatment for their injuries visited a hospital emergency department.
Conclusion: Given the increase in both the number and rates of fall-related injuries over time, there is a need to continue monitoring trends and injury patterns associated with falls.
Titre: Blessures liées à une chute chez les aînés canadiens entre 2005 et 2013 : une analyse de l’Enquête sur la santé dans les collectivités canadiennes.
Introduction: Nous décrivons l’épidémiologie et les tendances des blessures liées à une chute chez les aînés canadiens de 65 ans et plus selon le sexe et l’âge, ainsi que les circonstances et les conséquences de ces blessures.
Méthodologie: Nous avons utilisé des données représentatives tirées des échantillons de 2005, de 2009-2010 et de 2013 de l’Enquête sur la santé dans les collectivités canadiennes afin de calculer le nombre et les taux de blessures liées à une chute pour chaque année d’enquête. Nous avons combiné, dans la mesure du possible, les données d’au moins deux échantillons afin d’estimer la proportion de blessures liées à une chute par type de blessure, partie du corps affectée, type d’activité et type de traitement.
Résultats: Le taux de blessures liées à une chute chez les aînés est passé de 49,4 à 58,8 pour 1 000 personnes entre 2005 et 2013, période durant laquelle le nombre de blessures liées à une chute a de façon générale augmenté de 54 %. Les femmes ont présenté des taux plus élevés que les hommes pour toutes les années d’enquête, ces taux augmentant avec l’âge. La tendance à la hausse dans les taux de blessures liées à une chute était plus marquée chez les femmes et les plus jeunes. Les cassures et les fractures (37 %) ont été les blessures les plus courantes, et l’épaule et le bras (16 %) ont été les parties du corps les plus couramment affectées. Plusieurs blessures liées à une chute se sont produites alors que la personne marchait sur une surface non enneigée ou glacée (45 %). Plus de 70 % des aînés qui ont cherché à obtenir des soins médicaux pour leur blessure se sont rendus au service d’urgence d’un hôpital.
Conclusion: Compte tenu de l’augmentation du nombre et des taux de blessures liées à une chute au fil du temps, la surveillance des tendances et des profils de ces dernières demeure nécessaire.
Keywords: Canada; falls; seniors; unintentional injuries.
Figures
References
-
- Tinetti ME, Speechley M, Ginter SF. Risk factors for falls among elderly persons living in the community. N Engl J Med. 1988;319((26)):1701–7. - PubMed
-
- O’Loughlin JL, Robitaille Y, Boivin JF, Suissa S. Incidence of and risk factors for falls and injurious falls among the community-dwelling elderly. Am J Epidemiol. 1993;137((3)):342–54. - PubMed
-
- Tromp AM, Plujim SM, Smit JH, Deeg DJ, Bouter LM, Lips P. Fall-risk screening test: a prospective study on predictors for falls in community-dwelling elderly. J Clin Epidemiol. 2001;54((8)):837–44. - PubMed
-
- Gill T, Taylor AW, Pengelly A. A population-based survey of factors relating to the prevalence of falls in older people. Gerontology. 2005;51((5)):340–5. - PubMed
MeSH terms
LinkOut - more resources
Full Text Sources
Medical
