. 2015 Sep 17;10(9):e0138379.
doi: 10.1371/journal.pone.0138379. eCollection 2015.

Intra- and Inter-Task Reliability of Spatial Attention Measures in Pseudoneglect

Affiliations

Intra- and Inter-Task Reliability of Spatial Attention Measures in Pseudoneglect

Gemma Learmonth et al. PLoS One. .

Erratum in

Abstract

Healthy young adults display a leftward asymmetry of spatial attention ("pseudoneglect") that has been measured with a wide range of different tasks. Yet at present there is a lack of systematic evidence that the tasks commonly used in research today are i) stable measures over time and ii) provide similar measures of spatial bias. Fifty right-handed young adults were tested on five tasks (manual line bisection, landmark, greyscales, gratingscales and lateralised visual detection) on two different days. All five tasks were found to be stable measures of bias over the two testing sessions, indicating that each is a reliable measure in itself. Surprisingly, no strongly significant inter-task correlations were found. However, principal component analysis revealed left-right asymmetries to be subdivided in 4 main components, namely asymmetries in size judgements (manual line bisection and landmark), luminance judgements (greyscales), stimulus detection (lateralised visual detection) and judgements of global/local features (manual line bisection and grating scales). The results align with recent research on hemispatial neglect which conceptualises the condition as multi-component rather than a single pathological deficit of spatial attention. We conclude that spatial biases in judgment of visual stimulus features in healthy adults (e.g., pseudoneglect) is also a multi-component phenomenon that may be captured by variations in task demands which engage task-dependent patterns of activation within the attention network.


Conflict of interest statement

Competing Interests: The authors have declared that no competing interests exist.

Figures

Fig 1
Fig 1. Examples of the (a) manual line bisection (MLB), (b) landmark (LM), (c) greyscales (GRE) and (d) gratingscales (GRA) stimuli.
1a) Stimulus B is centred at the horizontal midpoint of the screen. Stimuli A and C represent the most extremely deviated stimuli along the horizontal axis, with Stimulus A jittered 160 pixels (3.8° visual angle (VA)) leftward and C jittered 160 pixels rightward relative to centre. 1b) The left and right sides of Stimulus A are of equal length, the left side of B is shorter by 24 pixels (0.53°) and the right side of C shorter by 24 pixels. 1c) A central “zone of interest” (640 pixels wide, 15.1°) was shifted in 10-pixel (0.24°) increments leftward and rightward. The shading gradient is continuous from left to right in Stimulus A and the central section is shifted leftward by -80 pixels (1.9°) in B. 1d) A 400-pixel wide (9.47°) zone of interest was shifted in 12-pixel (0.29°) increments leftward and rightward. The zone is centred in Stimulus A and shifted rightward by 96 pixels (2.28°) in B.
Fig 2
Fig 2. Mean bias for the MLB task.
* represents a significant leftward bias (p<0.002).
Fig 3
Fig 3. Mean psychometric function curves for the LM, GRE and GRA tasks.
The asymmetry of the presented stimulus is shown on the x-axis, where 0 = “both sides equal length” (LM) or “both bars equal darkness/thin stripes” (GRE/GRA respectively). Negative asymmetry values represent trials where the target feature is located on the left side and positive values on the right side. One unit on the x-axis equates to 3 pixels (0.07°) for the LM task, 10 pixels (0.24°) for GRE and 12 pixels (0.29°) for GRA.
Fig 4
Fig 4. Mean detection accuracy for the LVD task.
Separate curves for the left and right VFs are shown, across the 5 stimulus sizes.
Fig 5
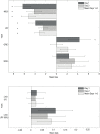
Fig 5. Grand average spatial attention bias for the 5 tasks.
Negative and positive values represent leftward and rightward biases respectively. The LM and MLB tasks show significantly leftward biases on both days and the GRE rightward on Day 1 only (± standard error of the mean (SEM)). The LVD task (d’ and PF 50%) is presented separately on the lower axes for clarity, due to smaller bias values. * represents a significant attentional bias compared to zero (p<0.05).
Fig 6
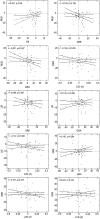
Fig 6. Intra-task correlations.
Day 1 vs Day 2 biases are significantly correlated for all 5 tasks (i.e. each task provides a stable measure) over the two testing days (all p-values <0.05). Line of best fit and 95% confidence intervals are marked. * represents a significant correlation at α = 0.05.
Fig 7
Fig 7. Inter-task correlations.
Only the mean task biases (Day 1 and Day 2 averaged) for the MLB and GRA tasks were significantly correlated at α = 0.05 prior to correction, with all other comparisons p>0.05. * represents significant correlation at α = 0.05 but not when Bonferroni corrected to α = 0.005.
Fig 8
Fig 8. Visualisation of principal component analysis (PCA) loadings.

References

    1. Bowers D, Heilman KM. Pseudoneglect: Effects of hemispace on a tactile line bisection task. Neuropsychologia 1980; 18(4–5): 491–8. 10.1016/0028-3932(80)90151-7 - DOI - PubMed
    1. Wilson B, Cockburn J, Halligan P. Development of a behavioral test of visuospatial neglect. Arch Phys Med Rehab. 1987; 68(2): 98–102. - PubMed
    1. Chechlacz M, Rotshtein P, Humphreys GW. Neuroanatomical dissections of unilateral visual neglect symptoms: ALE meta-analysis of lesion-symptom mapping. Front Hum Neurosci. 2012; 6 10.3389/fnhum.2012.00230 - DOI - PMC - PubMed
    1. Driver J, Vuilleumier P, Husain M. Spatial neglect and extinction In: Gazzaniga M, editor. The new cognitive neuroscience III. Cambridge: MIT Press; 2004. pp. 589–606.
    1. Halligan PW, Fink GR, Marshall JC, Vallar G. Spatial cognition: evidence from visual neglect. Trends Cogn Sci. 2003; 7(3): 125–133. - PubMed

Publication types

LinkOut - more resources