. 2015 Sep 17;10(9):e0138297.
doi: 10.1371/journal.pone.0138297. eCollection 2015.

EEGNET: An Open Source Tool for Analyzing and Visualizing M/EEG Connectome

Affiliations

EEGNET: An Open Source Tool for Analyzing and Visualizing M/EEG Connectome

Mahmoud Hassan et al. PLoS One. .

Abstract

The brain is a large-scale complex network often referred to as the "connectome". Exploring the dynamic behavior of the connectome is a challenging issue as both excellent time and space resolution is required. In this context Magneto/Electroencephalography (M/EEG) are effective neuroimaging techniques allowing for analysis of the dynamics of functional brain networks at scalp level and/or at reconstructed sources. However, a tool that can cover all the processing steps of identifying brain networks from M/EEG data is still missing. In this paper, we report a novel software package, called EEGNET, running under MATLAB (Math works, inc), and allowing for analysis and visualization of functional brain networks from M/EEG recordings. EEGNET is developed to analyze networks either at the level of scalp electrodes or at the level of reconstructed cortical sources. It includes i) Basic steps in preprocessing M/EEG signals, ii) the solution of the inverse problem to localize / reconstruct the cortical sources, iii) the computation of functional connectivity among signals collected at surface electrodes or/and time courses of reconstructed sources and iv) the computation of the network measures based on graph theory analysis. EEGNET is the unique tool that combines the M/EEG functional connectivity analysis and the computation of network measures derived from the graph theory. The first version of EEGNET is easy to use, flexible and user friendly. EEGNET is an open source tool and can be freely downloaded from this webpage: https://sites.google.com/site/eegnetworks/.


Conflict of interest statement

Competing Interests: The authors have declared that no competing interests exist.

Figures

Fig 1
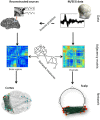
Fig 1. Basic workflow of EEGNET.
The M/EEG data are imported (256 dense EEG signals is this example). The functional connectivity is then computed directly between the scalp signals. Network measures can be extracted from the adjacency matrix and the scalp network can be visualized in an interactive way. On the other hand, the original M/EEG data can be used to estimate the brain sources by solving the inverse problem. Functional connectivity measures can be applied on the reconstructed sources. Graph measures can also be computed and the correspondent cortex network can be visualized. Node’s size and color can be used to encode any chosen network measures (their strength for instance) as well as the edges (their weight for instance).
Fig 2
Fig 2. Scalp networks.
A) The different steps performed to obtain a ‘static’ scalp network, B) typical example of the dynamics of scalp networks obtained during a picture naming task (see [47] for about the data). The node color represents the modules and the size represents the strength values.
Fig 3
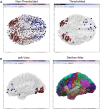
Fig 3. Example of the nodes visualization control.
A. All nodes are showed with and without thresholding (about 1000 ROIs). Node’s color represents the module and nod’s size represents the strength values. B. The left view of the same network with the corresponding Desikan Atlas imported from scout file.
Fig 4
Fig 4. Example of the edges visualization control.
A. Edge’s color represents strength values B. Multiview option (5 views) selected from the control panel (bottom).
Fig 5
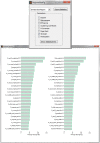
Fig 5. An example of the quantification analysis.
The strength measure is selected. The strength values for each ROIs in the left (L) and right (R) hemispheres are showed. The labels of the ROIs are used from the already loaded scout file.
Fig 6
Fig 6. Identification of brain networks involved in picture naming task.
A. The signals were loaded to EEGNET and the averaged signal over trials was visualized. The connectivity measure was chosen (PLV in this case) and the frequency bands were set to 30–45Hz (Low Gamma band). B. The network obtained at scalp level in the period 120–150ms. C. The network obtained at the same period after source reconstruction using wMNE and connectivity measurement (using PLV). D. The degree value of each nodes (based on Destrieux Atlas) was computed and visualized. E. The network obtained at 190–320ms after source reconstruction using wMNE and connectivity measurement (using PLV) and F. the corresponding degree values. Node’s color and size represent the modularity and the degree respectively. The time periods were chosen based on automatic segmentation of such cognitive task [47, 74].

References

    1. Bartolomei F, Bosma I, Klein M, Baayen JC, Reijneveld JC, Postma TJ, et al. How do brain tumors alter functional connectivity? A magnetoencephalography study. Annals of neurology. 2006;59(1):128–38. - PubMed
    1. Rodriguez E, George N, Lachaux JP, Martinerie J, Renault B, Varela FJ. Perception's shadow: long-distance synchronization of human brain activity. Nature. 1999;397(6718):430–3. - PubMed
    1. Hassan M, Dufor O, Merlet I, Berrou C, Wendling F. EEG Source Connectivity Analysis: From Dense Array Recordings to Brain Networks. PloS one. 2014;9(8):e105041 10.1371/journal.pone.0105041 - DOI - PMC - PubMed
    1. Schoffelen JM, Gross J. Source connectivity analysis with MEG and EEG. Human brain mapping. 2009;30(6):1857–65. 10.1002/hbm.20745 - DOI - PMC - PubMed
    1. Bullmore E, Sporns O. Complex brain networks: graph theoretical analysis of structural and functional systems. Nature Reviews Neuroscience. 2009;10(3):186–98. 10.1038/nrn2575 - DOI - PubMed

Publication types