. 2015 Aug 25:9:330.
doi: 10.3389/fncel.2015.00330. eCollection 2015.

Blockade of pathological retinal ganglion cell hyperactivity improves optogenetically evoked light responses in rd1 mice

Affiliations

Blockade of pathological retinal ganglion cell hyperactivity improves optogenetically evoked light responses in rd1 mice

John M Barrett et al. Front Cell Neurosci. .

Abstract

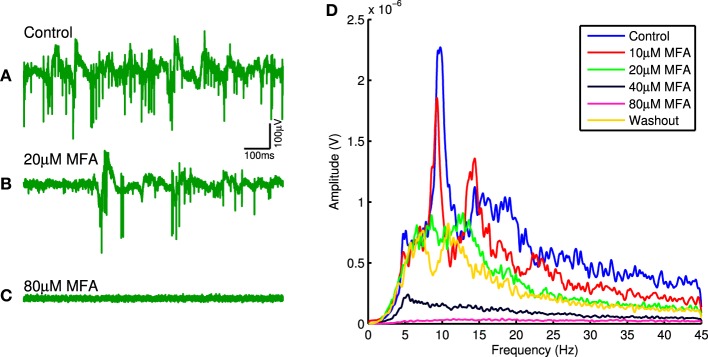
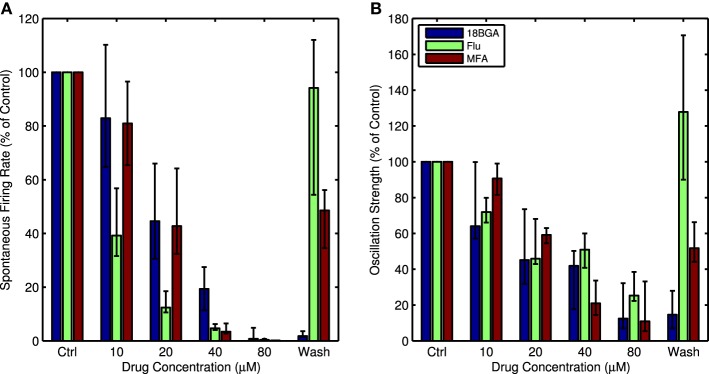
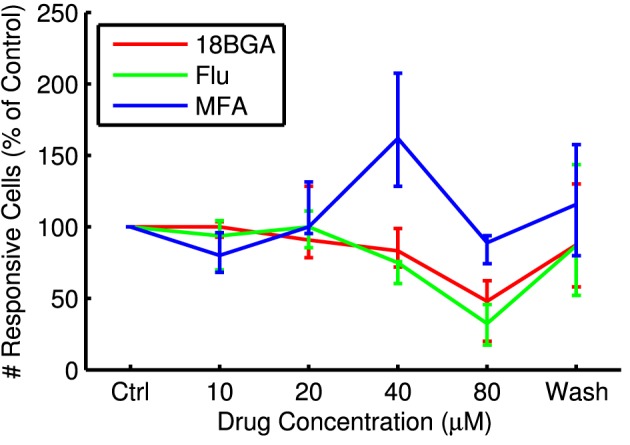
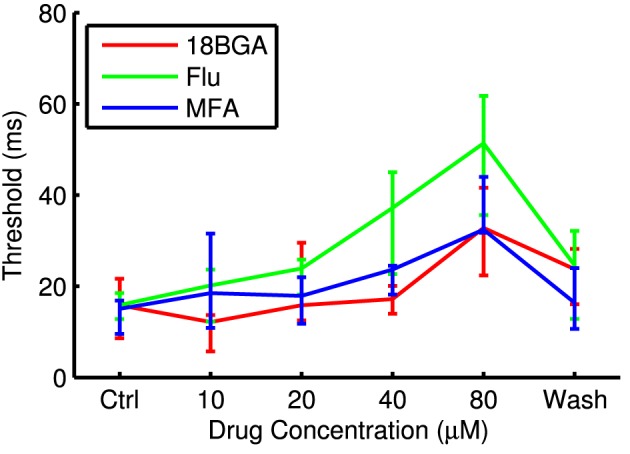
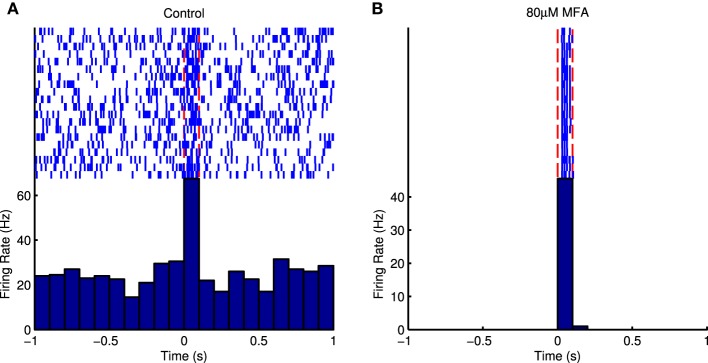
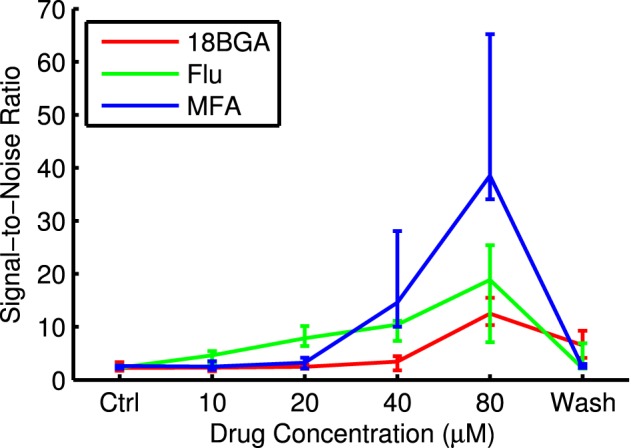
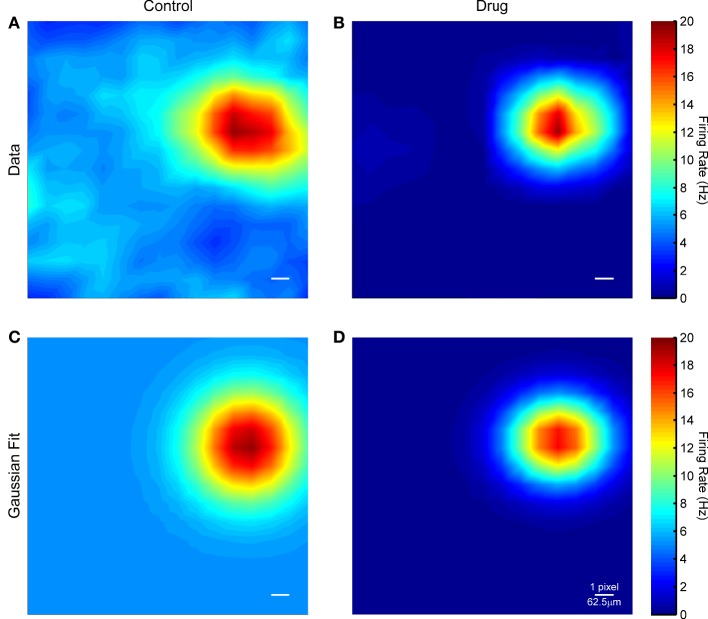
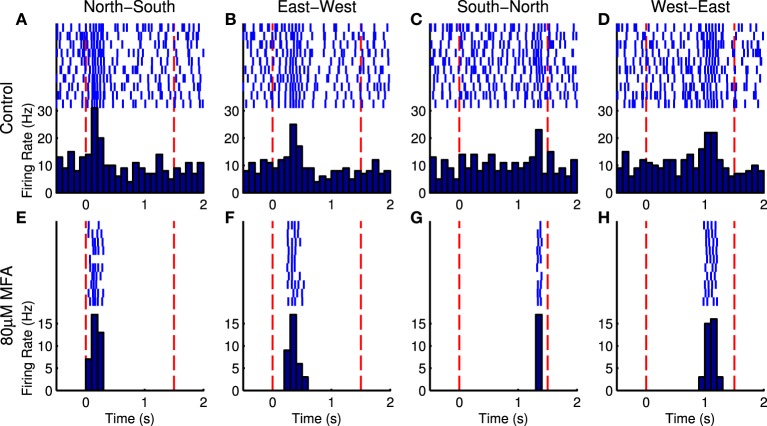
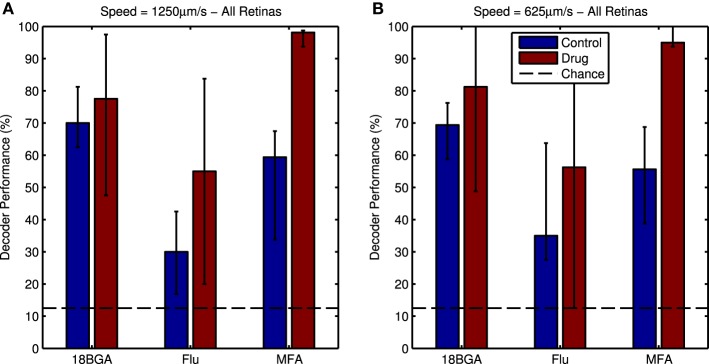
Retinitis pigmentosa (RP) is a progressive retinal dystrophy that causes visual impairment and eventual blindness. Retinal prostheses are the best currently available vision-restoring treatment for RP, but only restore crude vision. One possible contributing factor to the poor quality of vision achieved with prosthetic devices is the pathological retinal ganglion cell (RGC) hyperactivity that occurs in photoreceptor dystrophic disorders. Gap junction blockade with meclofenamic acid (MFA) was recently shown to diminish RGC hyperactivity and improve the signal-to-noise ratio (SNR) of RGC responses to light flashes and electrical stimulation in the rd10 mouse model of RP. We sought to extend these results to spatiotemporally patterned optogenetic stimulation in the faster-degenerating rd1 model and compare the effectiveness of a number of drugs known to disrupt rd1 hyperactivity. We crossed rd1 mice with a transgenic mouse line expressing the light-sensitive cation channel channelrhodopsin2 (ChR2) in RGCs, allowing them to be stimulated directly using high-intensity blue light. We used 60-channel ITO multielectrode arrays to record ChR2-mediated RGC responses from wholemount, ex-vivo retinas to full-field and patterned stimuli before and after application of MFA, 18-β-glycyrrhetinic acid (18BGA, another gap junction blocker) or flupirtine (Flu, a Kv7 potassium channel opener). All three drugs decreased spontaneous RGC firing, but 18BGA and Flu also decreased the sensitivity of RGCs to optogenetic stimulation. Nevertheless, all three drugs improved the SNR of ChR2-mediated responses. MFA also made it easier to discern motion direction of a moving bar from RGC population responses. Our results support the hypothesis that reduction of pathological RGC spontaneous activity characteristic in retinal degenerative disorders may improve the quality of visual responses in retinal prostheses and they provide insights into how best to achieve this for optogenetic prostheses.

Keywords: 18-beta-glycyrrhetinic acid; flupirtine; meclofenamic acid; optogenetics; retinal degeneration; retinal prosthesis; spontaneous activity.


Figures

Figure 1
Figure 1
(A–C) Raw electrode trace on one channel for an example retina in control conditions (A), with 20 μM MFA (B), and with 80 μM MFA (C). Note the decrease in both oscillations and level of spontaneous firing as the drug concentration increases. (D) Power spectra recorded on the same channel in control conditions, at each drug concentration and after washout. Notice the overall decrease in LFP power as the drug concentration increases and the recovery upon washout.
Figure 2
Figure 2
(A) Spontaneous firing rate as a percentage of control conditions for each concentration of all three drugs, averaged over all channels with recorded spikes and all retinas. (B) Oscillation strength as a percentage of control conditions for each concentration of all three drugs, averaged over all recorded channels and all retinas. For both figures, error bars show the interquartile range (IQR).
Figure 3
Figure 3
Number of cells responding to the longest μLED array flash at each drug concentration as a percentage of control conditions, averaged over all retinas.
Figure 4
Figure 4
Threshold flash duration for optogenetically sensitive cells at each drug concentration. Data points are median over all retinas of the median threshold of all cells that respond in both control conditions and at 80 μM drug. Error bars are IQR for all retinas.
Figure 5
Figure 5
(A) Raster plot and PSTH of an example cell in response to 100 ms full-field μLED flashes in control conditions. The light is on between the red dotted lines. It is difficult to distinguish the evoked responses from the spontaneous bursts that occur randomly between stimuli. (B) Raster plot and PSTH of the same cell in response to the same stimulus in the presence of 80 μM MFA. The spontaneous activity is abolished and the evoked response is very distinct.
Figure 6
Figure 6
Signal-to-noise ratio for responses to the longest μLED array flash at each drug concentration. Data points are median over all retinas of the median SNR of all cells that respond in both control conditions and at 80 μM drug and had measurable SNR values. Error bars are IQR for all retinas.
Figure 7
Figure 7
(A) Spike triggered average for an example RGC in control conditions. (B) Spike triggered average for the same cell in the presence of 80 μM MFA. (C,D) Gaussian fits to the data in (A,B). The scale bar in each panel is one μLED array pixel or approximately 62.5 μm in length.
Figure 8
Figure 8
Raster plots and PSTHs for an example in response to bars moving in the four cardinal compass directions at 625 μm/s in control conditions (A–D) and in the presence of 80 μM MFA (E–H). The bar appears at the first red dotted line, sweeps across the array, and disappears at the second red dotted line. On a trial-by-trial basis, random spontaneous bursts may corrupt the estimate of time to peak firing and hence when the bar enters the cell's receptive field. After blocking spontaneous activity, the cell only fires when the bar passes over its receptive field. This cell was located at the north-east corner of the array, so it reaches its peak firing rate very soon after bar onset when the bar starts in the north or east of the array (A,B,E,F), but very late when the bar originates in the south or west (C,D,G,H).
Figure 9
Figure 9
(A) Bayesian decoder performance for responses to the 1250 μm/s bars in control conditions (blue bars) and in the presence of 80 μM of each drug (red bars). Decoder performance is much higher in the presence of the drug. Dotted line indicates chance level performance. (B) the same plot for the 625 μm/s bars. For both panels, data points are medians over all retinas and error bars are IQRs.

References

    1. Al-Atabany W., McGovern B., Mehran K., Berlinguer-Palmini R., Degenaar P. (2013). A processing platform for optoelectronic/optogenetic retinal prosthesis. IEEE Trans. Biomed. Eng. 60, 781–791. 10.1109/TBME.2011.2177498 - DOI - PubMed
    1. Arenkiel B. R., Peca J., Davison I. G., Feliciano C., Deisseroth K., Augustine G. J., et al. . (2007). In vivo light-induced activation of neural circuitry in transgenic mice expressing channelrhodopsin-2. Neuron 54, 205–218. 10.1016/j.neuron.2007.03.005 - DOI - PMC - PubMed
    1. Asl M. N., Hosseinzadeh H. (2008). Review of pharmacological effects of Glycyrrhiza sp. and its bioactive compounds. Phytother. Res. 22, 709–724. 10.1002/ptr.2362 - DOI - PMC - PubMed
    1. Barrett J. M., Berlinguer-Palmini R., Degenaar P. (2014). Optogenetic approaches to retinal prosthesis. Vis. Neurosci. 31, 345–354. 10.1017/S0952523814000212 - DOI - PMC - PubMed
    1. Bernstein J. G., Boyden E. S. (2011). Optogenetic tools for analyzing the neural circuits of behavior. Trends Cogn. Sci. 15, 592–600. 10.1016/j.tics.2011.10.003 - DOI - PMC - PubMed