. 2015 Aug 26:6:1280.
doi: 10.3389/fpsyg.2015.01280. eCollection 2015.

Reduction in ventral striatal activity when anticipating a reward in depression and schizophrenia: a replicated cross-diagnostic finding

Affiliations

Reduction in ventral striatal activity when anticipating a reward in depression and schizophrenia: a replicated cross-diagnostic finding

Gonzalo Arrondo et al. Front Psychol. .

Abstract

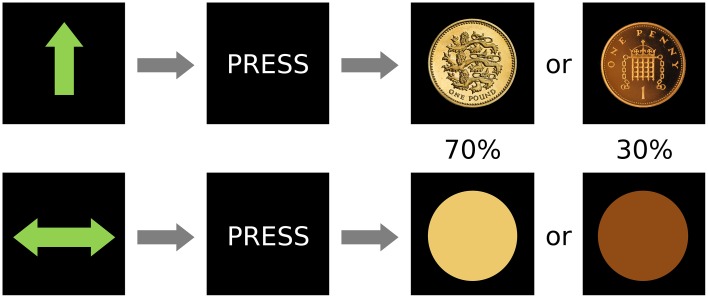
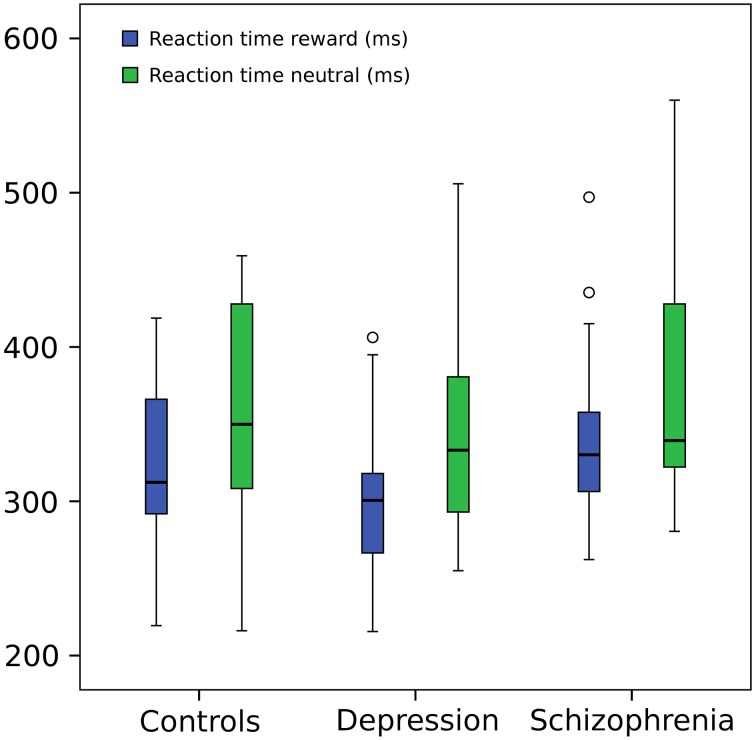
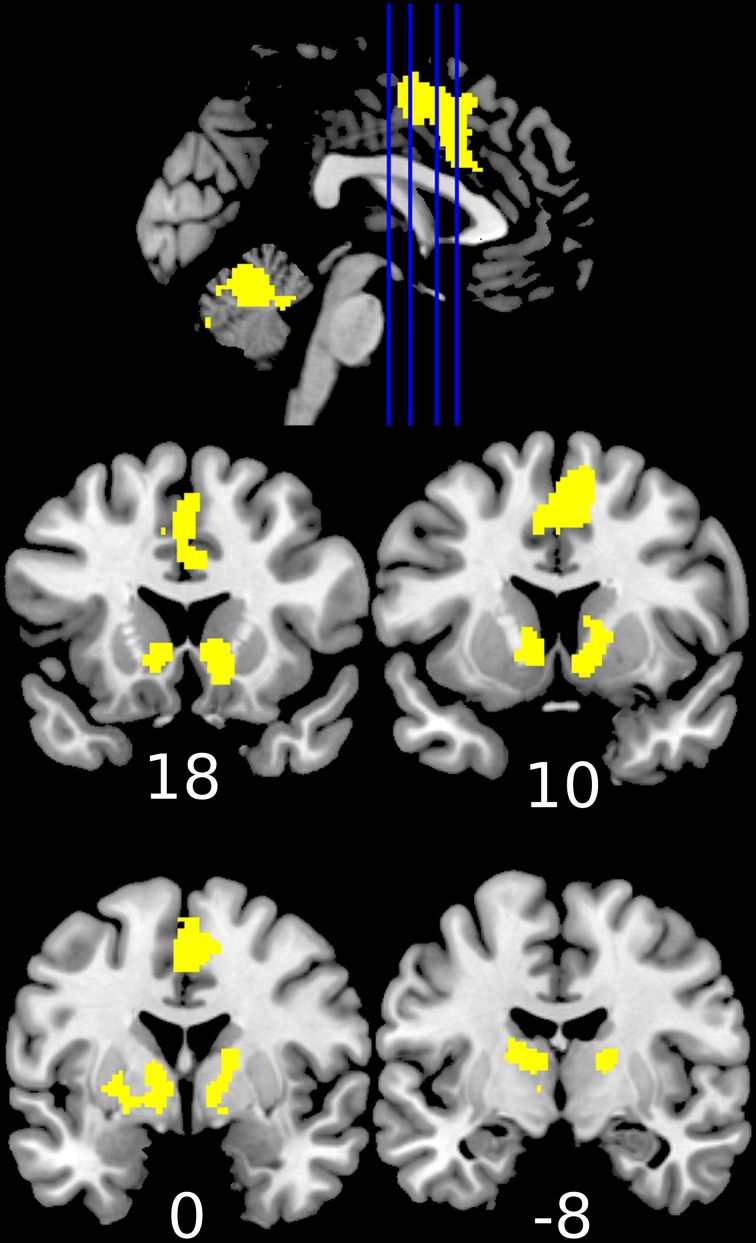
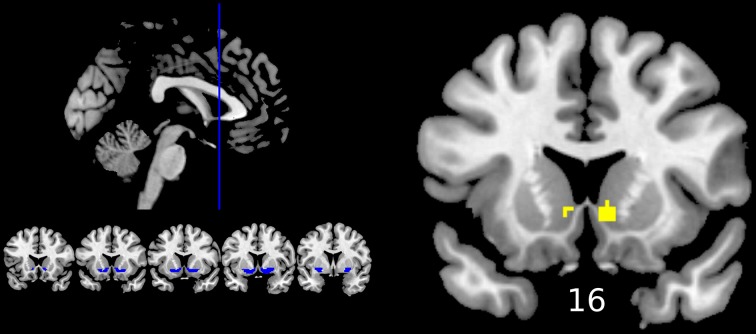
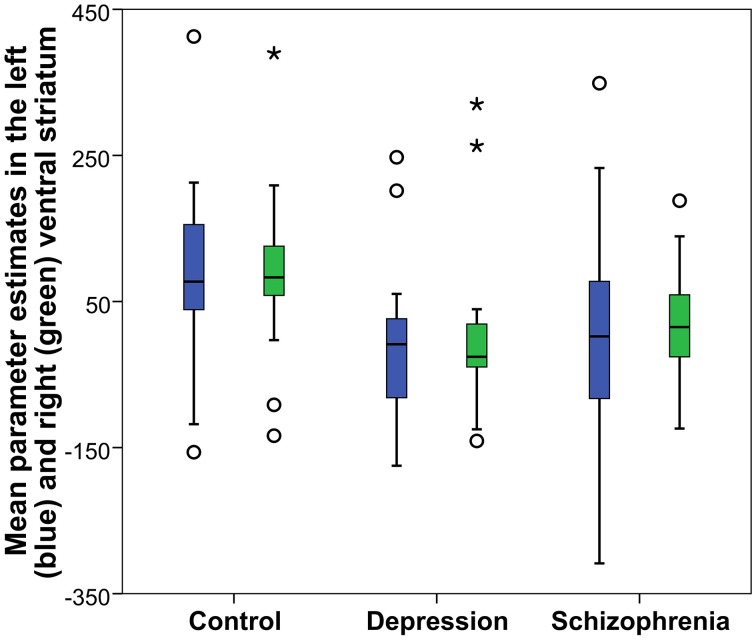
In the research domain framework (RDoC), dysfunctional reward expectation has been proposed to be a cross-diagnostic domain in psychiatry, which may contribute to symptoms common to various neuropsychiatric conditions, such as anhedonia or apathy/avolition. We used a modified version of the Monetary Incentive Delay (MID) paradigm to obtain functional MRI images from 22 patients with schizophrenia, 24 with depression and 21 controls. Anhedonia and other symptoms of depression, and overall positive and negative symptomatology were also measured. We hypothesized that the two clinical groups would have a reduced activity in the ventral striatum when anticipating reward (compared to anticipation of a neutral outcome) and that striatal activation would correlate with clinical measures of motivational problems and anhedonia. Results were consistent with the first hypothesis: two clusters in both the left and right ventral striatum were found to differ between the groups in reward anticipation. Post-hoc analysis showed that this was due to higher activation in the controls compared to the schizophrenia and the depression groups in the right ventral striatum, with activation differences between depression and controls also seen in the left ventral striatum. No differences were found between the two patient groups, and there were no areas of abnormal cortical activation in either group that survived correction for multiple comparisons. Reduced ventral striatal activity was related to greater anhedonia and overall depressive symptoms in the schizophrenia group, but not in the participants with depression. Findings are discussed in relation to previous literature but overall are supporting evidence of reward system dysfunction across the neuropsychiatric continuum, even if the specific clinical relevance is still not fully understood. We also discuss how the RDoC approach may help to solve some of the replication problems in psychiatric fMRI research.

Keywords: depressive symptoms; monetary incentive delay; research domain framework; reward system; ventral striatum.


Figures

Figure 1
Figure 1
Design of the paradigm. There were two conditions, reward (top) and neutral (bottom) that were signaled by an unambiguous cue and were followed by the subject pressing a button and then by two possible outcomes with different frequencies (0.7 or 0.3 probability of occurrence).
Figure 2
Figure 2
Reaction time. Repeated measures ANOVA (within subject factor: condition, between subject factor: group): reaction times in reward trials were shorter (F = 36.71, p = 0.001) but did not differ between groups (F = 0.384, p = 0.683). For graphical purposes a subject from the depression group was eliminated from the image due to a much greater mean RT (around 800 ms) in both conditions, but included in the statistical analysis (However, its elimination from the ANOVA did not change significant results). Central line represents the median value (second quartile, Q2) and the box borders indicate the 1st (Q1) and 3rd quartile (Q3). Hence, the total length of the box is the interquartile range (IQR). Whiskers mark last value in the sample located between the 1.5 × IQR below Q1 and 1.5 × IQR above Q3. Circles represent data between the 1.5 and 3 × IQR below Q1 or above Q3.
Figure 3
Figure 3
Increased activation during the anticipation of a reward (reward cue vs. neutral cue) in the healthy controls (1-sample t-test of the first level contrast between reward and neutral cues). Yellow color indicates voxels within significant clusters corrected at the whole brain level (cluster family wise error corrected p < 0.05 after a cluster-inducing primary threshold of Z>3). Numbers under slices indicate mm in the MNI coordinate system. The left side of the image represents the left side of the brain.
Figure 4
Figure 4
Differences between groups in reward anticipation (One-Way ANOVA of the first level contrast between reward and neutral cues). Yellow color indicates voxels within significant clusters: cluster family wise error corrected p < 0.05 within the ventral striatum after a cluster-inducing primary threshold of Z > 3. The region of interest is shown in blue on the left of the image. For improved visualization cluster limits are not circumscribed to our ROI. Differences were driven by greater activations in the healthy controls group compared to both groups of patients (right ventral striatum) or only the depression group (left ventral striatum). Numbers under slices indicate mm in the MNI coordinate system. The left side of the image represents the left side of the brain.
Figure 5
Figure 5
Reward anticipation mean parameter estimates in the accumbens nucleus: Obtained from the right and left significant clusters (p < 0.05 FWE cluster corrected after a cluster-inducing threshold of Z > 3 within a ventral striatum ROI) in the between groups One-Way ANOVA of the first level contrast comparing reward and neutral cues. Parameter estimates are arbitrarily scaled values. Central line represents the median value (second quartile, Q2) and the box borders indicate the 1st (Q1), and 3rd quartile (Q3). Hence, the total length of the box is the interquartile range (IQR). Whiskers mark last value in the sample located between the 1.5 × IQR below Q1 and 1.5 × IQR above Q3. Circles represent data between the 1.5 and 3 × IQR below Q1 or above Q3, whereas asterisks are data further apart from the median.

References

    1. American Psychiatric Association (2000). Diagnostic and Statistical Manual of Mental Disorders. Washington, DC: American Psychiatric Association.
    1. Argyropoulos S. V., Nutt D. J. (2013). Anhedonia revisited: is there a role for dopamine-targeting drugs for depression? J. Psychopharmacol. 27, 869–877. 10.1177/0269881113494104 - DOI - PubMed
    1. Arrondo G., Murray G. K., Hill E., Szalma B., Yathiraj K., Denman C., et al. . (2015). Hedonic and disgust taste perception in borderline personality disorder and depression. Br. J. Psychiatry 207, 79–80. 10.1192/bjp.bp.114.150433 - DOI - PMC - PubMed
    1. Barch D. M., Dowd E. C. (2010). Goal representations and motivational drive in schizophrenia: the role of prefrontal-striatal interactions. Schizophr. Bull. 36, 919–934. 10.1093/schbul/sbq068 - DOI - PMC - PubMed
    1. Barch D. M., Treadway M. T., Schoen N. (2014). Effort, anhedonia, and function in schizophrenia: reduced effort allocation predicts amotivation and functional impairment. J. Abnorm. Psychol. 123, 387–397. 10.1037/a0036299 - DOI - PMC - PubMed

LinkOut - more resources