

Association between plasma homocysteine and progression of early nephropathy in type 2 diabetic patients
- PMID: 26379920
- PMCID: PMC4565303
Association between plasma homocysteine and progression of early nephropathy in type 2 diabetic patients
Abstract
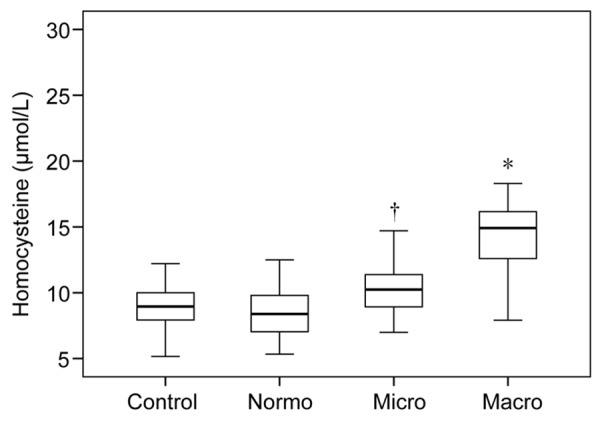
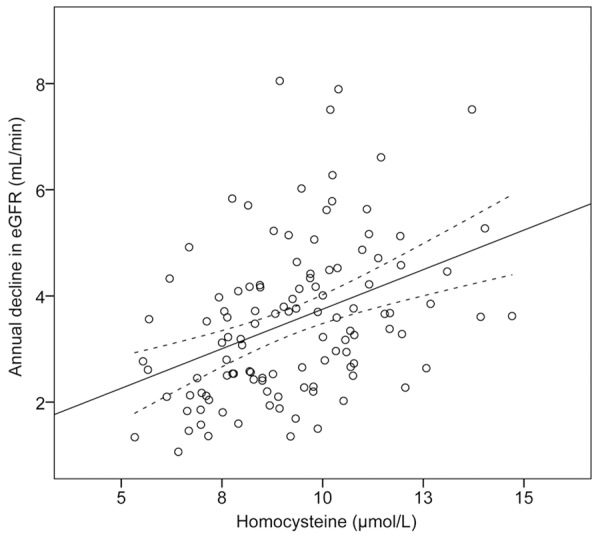
There is now growing evidence supporting the association between renal insufficiency and accumulation of plasma homocysteine (Hcy). However, the role of Hcy in the development of diabetic nephropathy (DN) in type 2 diabetic patients is not clearly elucidated. To this end, we performed a prospective observational study in 208 patients and 49 controls. We show that baseline level of Hcy is significantly enhanced in patients with DN and is associated with the severity of the disease. Focusing on patients at early DN stage (n = 157), after four-year follow-up, we find that increase in plasma Hcy level correlates with greater renal failure characterized by faster decline in estimated glomerular filtration rate (eGFR). Using a multivariate linear regression model, we show that plasma Hcy remains significantly associated with eGFR decline after controlling for other progression promoters. Our results support that plasma Hcy is an independent risk factor as well as an early predictor for DN progression in type 2 diabetic patients.
Keywords: Homocysteine; diabetic nephropathy; glomerular filtration rate.
Figures
Similar articles
-
The association of homocysteine level with the risk of diabetic nephropathy and diabetic retinopathy in NHANES.Acta Diabetol. 2023 Jul;60(7):907-916. doi: 10.1007/s00592-023-02075-2. Epub 2023 Mar 30. Acta Diabetol. 2023. PMID: 36997800
-
Serum homocysteine concentration as a marker for advanced diabetic nephropathy in a cohort of elderly patients.BMC Endocr Disord. 2023 May 22;23(1):114. doi: 10.1186/s12902-023-01342-1. BMC Endocr Disord. 2023. PMID: 37217896 Free PMC article.
-
Plasma Homocysteine as a Potential Marker of Early Renal Function Decline in IgA Nephropathy.Front Med (Lausanne). 2022 Mar 7;9:812552. doi: 10.3389/fmed.2022.812552. eCollection 2022. Front Med (Lausanne). 2022. PMID: 35321472 Free PMC article.
-
Lessons learned from studies of the natural history of diabetic nephropathy in young type 1 diabetic patients.Pediatr Endocrinol Rev. 2008 Aug;5 Suppl 4:958-63. Pediatr Endocrinol Rev. 2008. PMID: 18806710 Review.
-
Fenofibrate, homocysteine and renal function.Curr Vasc Pharmacol. 2010 Sep;8(5):589-603. doi: 10.2174/157016110792006987. Curr Vasc Pharmacol. 2010. PMID: 20507276 Review.
Cited by
-
Relationship between plasma total homocysteine and the severity of renal function in Chinese patients with type 2 diabetes mellitus aged ≥75 years.Medicine (Baltimore). 2020 Jul 2;99(27):e20737. doi: 10.1097/MD.0000000000020737. Medicine (Baltimore). 2020. PMID: 32629650 Free PMC article.
-
Threshold effect of plasma total homocysteine levels on cognitive function among hypertensive patients in China: A cross-sectional study.Front Neurol. 2022 Aug 18;13:890499. doi: 10.3389/fneur.2022.890499. eCollection 2022. Front Neurol. 2022. PMID: 36061998 Free PMC article.
-
Hyperhomocysteinemia is an independent risk factor of atherosclerosis in patients with metabolic syndrome.Diabetol Metab Syndr. 2019 Oct 26;11:87. doi: 10.1186/s13098-019-0484-0. eCollection 2019. Diabetol Metab Syndr. 2019. PMID: 31673296 Free PMC article.
-
Serum Homocysteine Level Is Positively Correlated With Serum Uric Acid Level in U.S. Adolescents: A Cross Sectional Study.Front Nutr. 2022 Mar 29;9:818836. doi: 10.3389/fnut.2022.818836. eCollection 2022. Front Nutr. 2022. PMID: 35425802 Free PMC article.
-
Genetically elevated circulating homocysteine concentrations increase the risk of diabetic kidney disease in Chinese diabetic patients.J Cell Mol Med. 2019 Apr;23(4):2794-2800. doi: 10.1111/jcmm.14187. Epub 2019 Feb 7. J Cell Mol Med. 2019. PMID: 30729677 Free PMC article.
References
-
- Nielsen SE, Reinhard H, Zdunek D, Hess G, Gutiérrez OM, Wolf M, Parving HH, Jacobsen PK, Rossing P. Tubular markers are associated with decline in kidney function in proteinuric type 2 diabetic patients. Diabetes Res Clin Pract. 2012;97:71–76. - PubMed
-
- Choudhury D, Tuncel M, Levi M. Diabetic nephropathy-- a multifaceted target of new therapies. Discov Med. 2010;10:406–415. - PubMed
-
- Rossing P, Rossing K, Gaede P, Pedersen O, Parving HH. Monitoring kidney function in type 2 diabetic patients with incipient and overt diabetic nephropathy. Diabetes Care. 2006;29:1024–1030. - PubMed
LinkOut - more resources
Full Text Sources
Research Materials
Miscellaneous