. 2015 Sep 14:4:42.
doi: 10.1186/s13742-015-0084-3. eCollection 2015.

Metabolome of human gut microbiome is predictive of host dysbiosis

Affiliations

Metabolome of human gut microbiome is predictive of host dysbiosis

Peter E Larsen et al. Gigascience. .

Abstract

Background: Humans live in constant and vital symbiosis with a closely linked bacterial ecosystem called the microbiome, which influences many aspects of human health. When this microbial ecosystem becomes disrupted, the health of the human host can suffer; a condition called dysbiosis. However, the community compositions of human microbiomes also vary dramatically from individual to individual, and over time, making it difficult to uncover the underlying mechanisms linking the microbiome to human health. We propose that a microbiome's interaction with its human host is not necessarily dependent upon the presence or absence of particular bacterial species, but instead is dependent on its community metabolome; an emergent property of the microbiome.

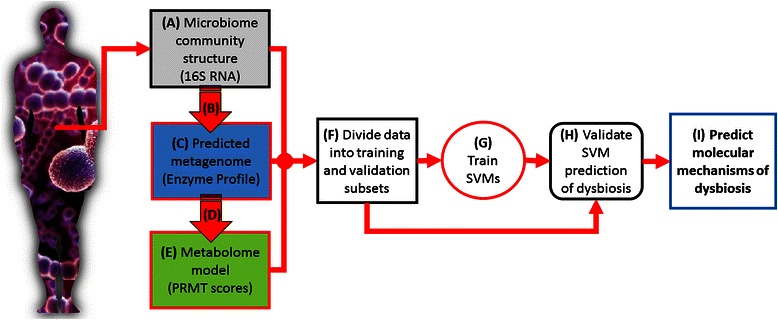
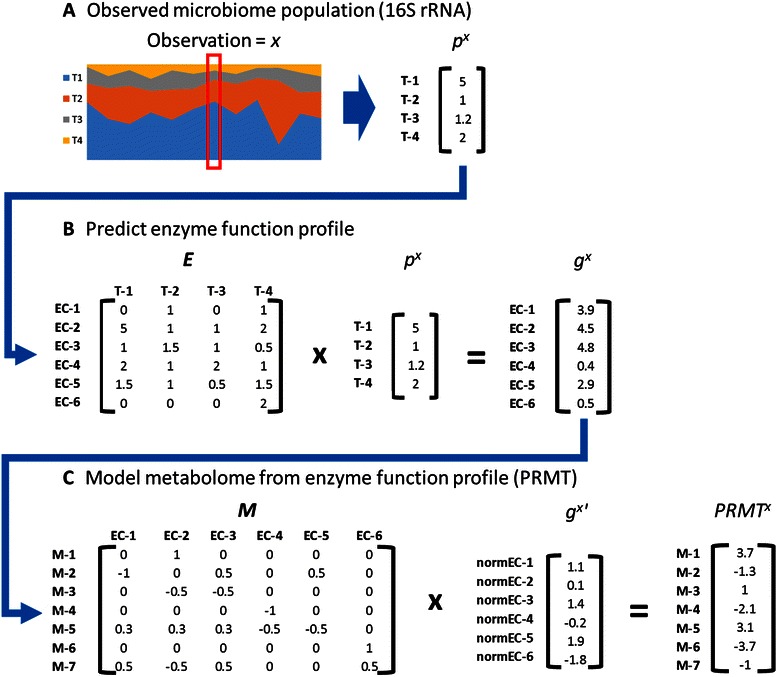
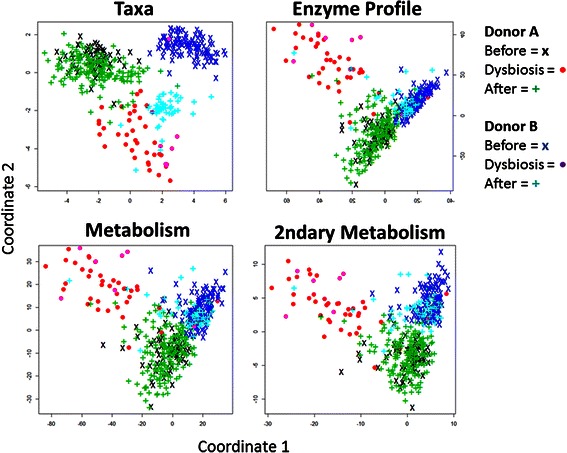
Results: Using data from a previously published, longitudinal study of microbiome populations of the human gut, we extrapolated information about microbiome community enzyme profiles and metabolome models. Using machine learning techniques, we demonstrated that the aggregate predicted community enzyme function profiles and modeled metabolomes of a microbiome are more predictive of dysbiosis than either observed microbiome community composition or predicted enzyme function profiles.

Conclusions: Specific enzyme functions and metabolites predictive of dysbiosis provide insights into the molecular mechanisms of microbiome-host interactions. The ability to use machine learning to predict dysbiosis from microbiome community interaction data provides a potentially powerful tool for understanding the links between the human microbiome and human health, pointing to potential microbiome-based diagnostics and therapeutic interventions.

Keywords: Dysbiosis; Gut microbiome; Human microbiome; Machine learning; Metabolome modeling; Metagenomics; Microbial communities.


Figures

Fig. 1
Fig. 1
Outline of experimental design. (A) 16S rRNA microbiome data, previously reported by David et al. [49], followed the microbiome community structures of two human donors over the course of a year at nearly daily intervals. Microbiome samples can be grouped into dysbiotic states and non-dysbiotic states from observed shifts in microbiome community structures, and knows changes in donors’ health and activities. Using collected sequences and annotated bacterial genomes (B), metagenomic enzyme profiles were predicted from reported 16S rRNA community structures (C). Using the predicted relative metabolic turnover (PRMT) method (D), metabolic models were generated from enzyme function profiles (E). All three data types (A, C, and E) were divided into training and validation subsets (F). Two approaches were used to divide data into training and validation subsets. The first combined data from donors and selected training and validation subsets to contain an approximately equal number of samples from each donor. In the second approach, training data were selected from a subset of one donor, and all data from the alternate donor were used for the validation set. (G) Support vector machines (SVMs) were used to build predictive models from training data sets for each data type. Models predicted whether samples were collected from a donor with a non-dysbiotic or dysbiotic state. (H) SVM models were validated on data subsets selected in (F). Using features identified as highly predictive for dysbiosis in validated SVM from (G), the molecular mechanisms underlying dysbiosis can be proposed (I)
Fig. 2
Fig. 2
Bray-Curtis dissimilarity indices between all microbiome community structures. BC indices between all pairs of metagenomic samples are indicated for Donor A and Donor B. Samples identified as dysbiotic are indicated in red in left and top borders. Colors in heat map are relative to BC index, with red indicating higher BC indices, green lower indices, and yellow intermediate values. The minimum BC index in the matrix is 54
Fig. 3
Fig. 3
Outline of enzyme function profile prediction and metabolome modeling from microbiome community data. In a, data from multiple observations from the microbiome are collected in the form of 16S rRNA abundances. For each observation in each dataset, where a single observation is denoted in the cartoon by red box, the microbiome population is described as a vector of normalized bacterial abundances, p. In this cartoon example, the microbiome is composed of four taxa, T 1–4. In b, the microbiome population is used to predict the enzyme function profile using a matrix of average enzyme function counts for all bacterial taxa, E. Matrix E is generated from analysis of published and annotated bacterial genomes. In this cartoon, there are six possible enzyme functions, EC 1–6. In the matrix presented, for example, the average genome of taxa 1 contains two genes annotated with enzyme function EC-4. The result of this step is a matrix for the microbiome’s enzyme function profile, g. In c, the normalized enzyme function profile g’ is used to calculate a model of the community metabolome as a vector of PRMT scores. This uses an interaction matrix M of enzyme functions and metabolites. In the cartoon example, M is comprised of the six enzyme activities in g and seven possible metabolites, m 1–7. Matrix M is generated from available databases of all possible bacterial metabolic reactions for all enzyme activities found in enzyme function profile
Fig. 4
Fig. 4
Multidimensional scaling plots for microbiome feature data types. In multidimensional scaling (MDS) plots, each point represents one microbiome sample for two donors (Donors A and B) and three conditions (before dysbiosis, dysbiosis, and after dysbiosis). Four microbiome data features are considered: taxonomic population structures (Taxa), community enzyme function profiles (Enzyme Profile), community total metabolome (Metabolism), and community secondary metabolome (2ndary Metabolism). Points that cluster nearer to one another in an MDS plot are more similar to one another
Fig. 5
Fig. 5
Bray-Curtis dissimilarity between average bacterial populations, grouped by donor and dysbiotic state. Sample data from community structure, enzyme function profile, and community metabolic model were averaged, and grouped by donor and by dysbiosis status. BC indices between all pairs of averaged communities for each data type are presented. Colors in heat map are relative to BC index, with red indicating higher BC indices, green lower indices, and yellow intermediate values
Fig. 6
Fig. 6
Predicting host status on four types of microbiome information: combined donor results. Each point on the graph shows the results of an SVM trained on a subset of community structure, enzyme function profile, and community total and secondary metabolism. The X-axis is the percent of features, selected from top-ranked Fisher score, used to train SVMs. Y-axis is the F-score for the prediction accuracy of the SVM model. Red ‘Xs’ identify the training data subsets that produced the most predictive models
Fig. 7
Fig. 7
Predicting host status on four types of microbiome information: cross-donor validation results. F-scores for cross-donor SVM predictions are given by black (model trained on Donor A data and validated on donor B data), and gray (model trained on Donor B data and validated on Donor A data) bars. F-scores for SVM trained on mixed-model data are displayed as red ‘Xs’; values were taken from the most predictive SVM parameters and training sets identified from Fig. 7
Fig. 8
Fig. 8
Determining the effect of gene annotation errors on the prediction of community enzyme function profile and community metabolism. On the X-axis, the amount of noise added to genera-level average enzyme function counts is given as a factor of n standard deviations. Y-axis is the Pearson’s correlation coefficient between the noise-added dataset and original data. Error bars are ± one standard deviation from five experimental replications

Similar articles

Cited by

References

    1. Yoon SS, Kim EK, Lee WJ. Functional genomic and metagenomic approaches to understanding gut microbiota-animal mutualism. Curr Opin Microbiol. 2015;24:38–46. doi: 10.1016/j.mib.2015.01.007. - DOI - PubMed
    1. Wang WL, Xu SY, Ren ZG, Tao L, Jiang JW, Zheng SS. Application of metagenomics in the human gut microbiome. World J Gastroenterol. 2015;21(3):803–14. - PMC - PubMed
    1. Gosalbes MJ, Abellan JJ, Durban A, Perez-Cobas AE, Latorre A, Moya A. Metagenomics of human microbiome: beyond 16 s rDNA. Clin Microbiol Infect. 2012;18(Suppl 4):47–9. doi: 10.1111/j.1469-0691.2012.03865.x. - DOI - PubMed
    1. Bou Saab J, Losa D, Chanson M, Ruez R. Connexins in respiratory and gastrointestinal mucosal immunity. FEBS Lett. 2014;588(8):1288–96. doi: 10.1016/j.febslet.2014.02.059. - DOI - PubMed
    1. Walsh CJ, Guinane CM, O’Toole PW, Cotter PD. Beneficial modulation of the gut microbiota. FEBS Lett. 2014;588(22):4120–30. doi: 10.1016/j.febslet.2014.03.035. - DOI - PubMed

Publication types