

Determination of nonlinear genetic architecture using compressed sensing
- PMID: 26380078
- PMCID: PMC4570224
- DOI: 10.1186/s13742-015-0081-6
Determination of nonlinear genetic architecture using compressed sensing
Abstract
Background: One of the fundamental problems of modern genomics is to extract the genetic architecture of a complex trait from a data set of individual genotypes and trait values. Establishing this important connection between genotype and phenotype is complicated by the large number of candidate genes, the potentially large number of causal loci, and the likely presence of some nonlinear interactions between different genes. Compressed Sensing methods obtain solutions to under-constrained systems of linear equations. These methods can be applied to the problem of determining the best model relating genotype to phenotype, and generally deliver better performance than simply regressing the phenotype against each genetic variant, one at a time. We introduce a Compressed Sensing method that can reconstruct nonlinear genetic models (i.e., including epistasis, or gene-gene interactions) from phenotype-genotype (GWAS) data. Our method uses L1-penalized regression applied to nonlinear functions of the sensing matrix.
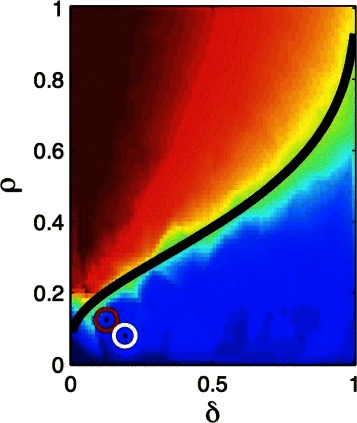
Results: The computational and data resource requirements for our method are similar to those necessary for reconstruction of linear genetic models (or identification of gene-trait associations), assuming a condition of generalized sparsity, which limits the total number of gene-gene interactions. An example of a sparse nonlinear model is one in which a typical locus interacts with several or even many others, but only a small subset of all possible interactions exist. It seems plausible that most genetic architectures fall in this category. We give theoretical arguments suggesting that the method is nearly optimal in performance, and demonstrate its effectiveness on broad classes of nonlinear genetic models using simulated human genomes and the small amount of currently available real data. A phase transition (i.e., dramatic and qualitative change) in the behavior of the algorithm indicates when sufficient data is available for its successful application.
Conclusion: Our results indicate that predictive models for many complex traits, including a variety of human disease susceptibilities (e.g., with additive heritability h (2)∼0.5), can be extracted from data sets comprised of n ⋆∼100s individuals, where s is the number of distinct causal variants influencing the trait. For example, given a trait controlled by ∼10 k loci, roughly a million individuals would be sufficient for application of the method.
Keywords: Compressed sensing; Genomics; Nonlinear interactions.
Figures
References
-
- Elad M. Sparse and redundant representations: from theory to applications in signal and image processing. New York, USA: Springer; 2010.
-
- Candès E. Compressive sampling. In: Proceedings of the International Congress of Mathematicians. Madrid, Spain: 2006. p. 1433–1452.
-
- Donoho DL. Compressed sensing. IEEE T Inform Theory. 2006;52:1289. doi: 10.1109/TIT.2006.871582. - DOI
-
- Foucart S, Rauhut H. A mathematical introduction to compressive sensing. Applied and Numerical Harmonic Analysis book series. New York, USA: Springer; 2013.
Publication types
MeSH terms
LinkOut - more resources
Full Text Sources
Other Literature Sources
