Review
. 2015 Sep 2:4:743.
doi: 10.1038/bonekey.2015.112. eCollection 2015.

The fracture mechanics of human bone: influence of disease and treatment

Affiliations
Review

The fracture mechanics of human bone: influence of disease and treatment

Elizabeth A Zimmermann et al. Bonekey Rep. .

Abstract

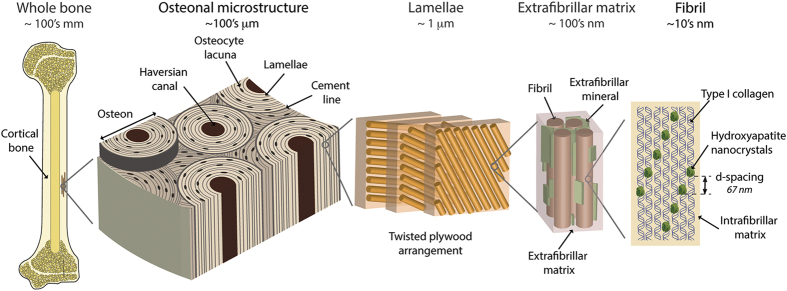
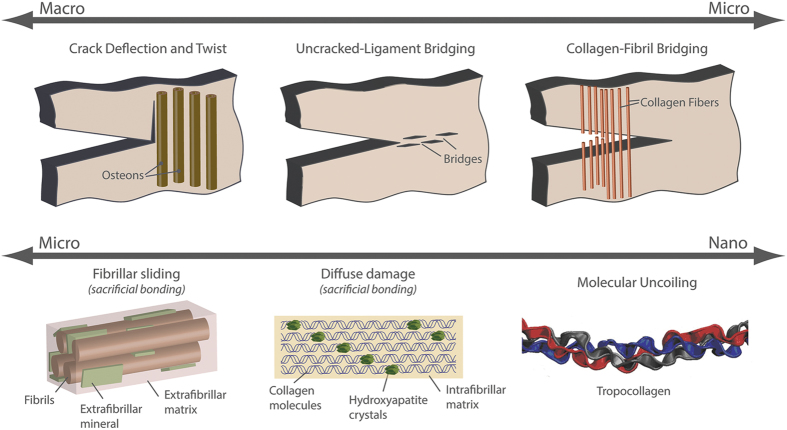
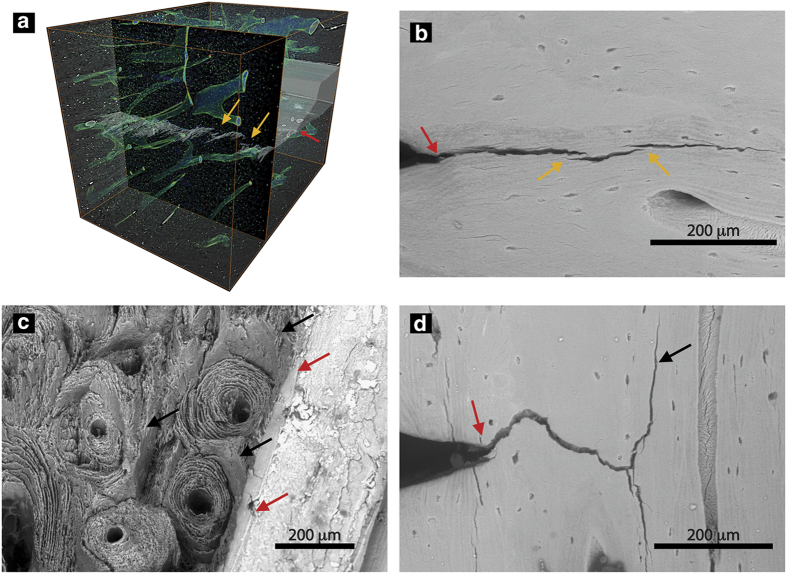
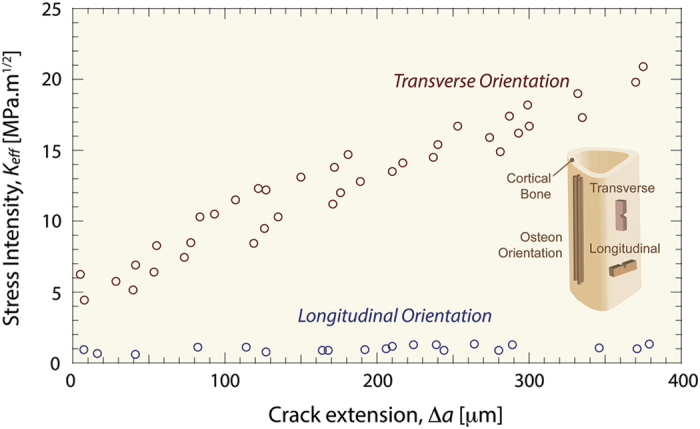
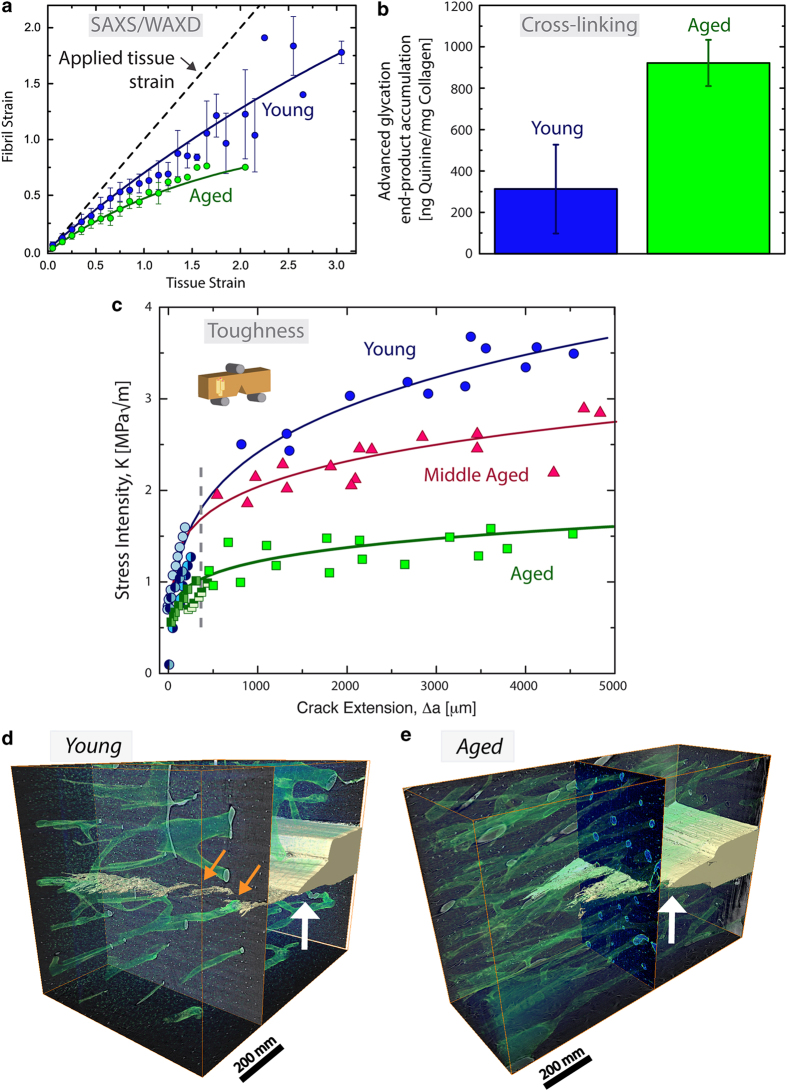
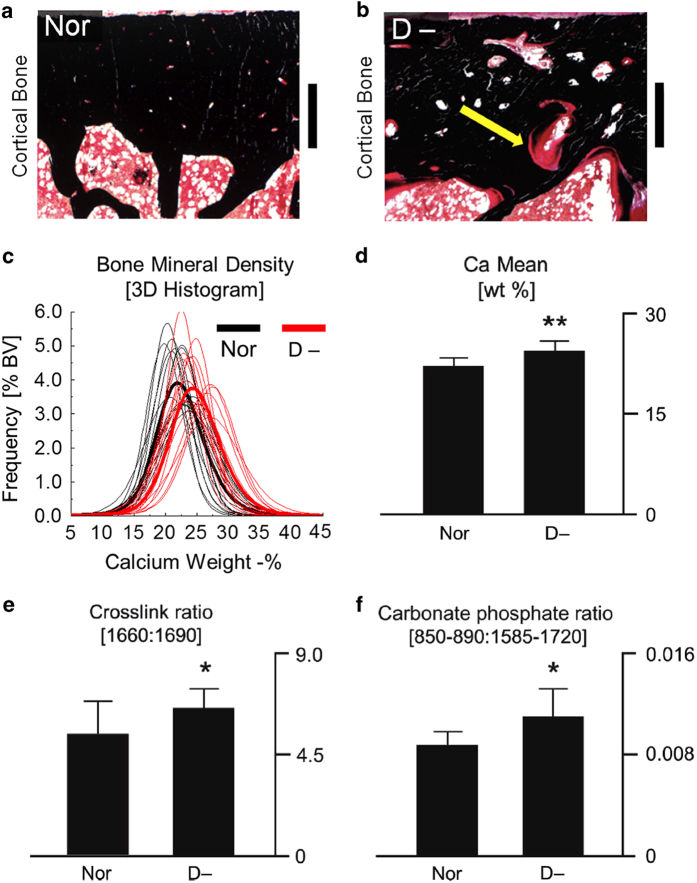
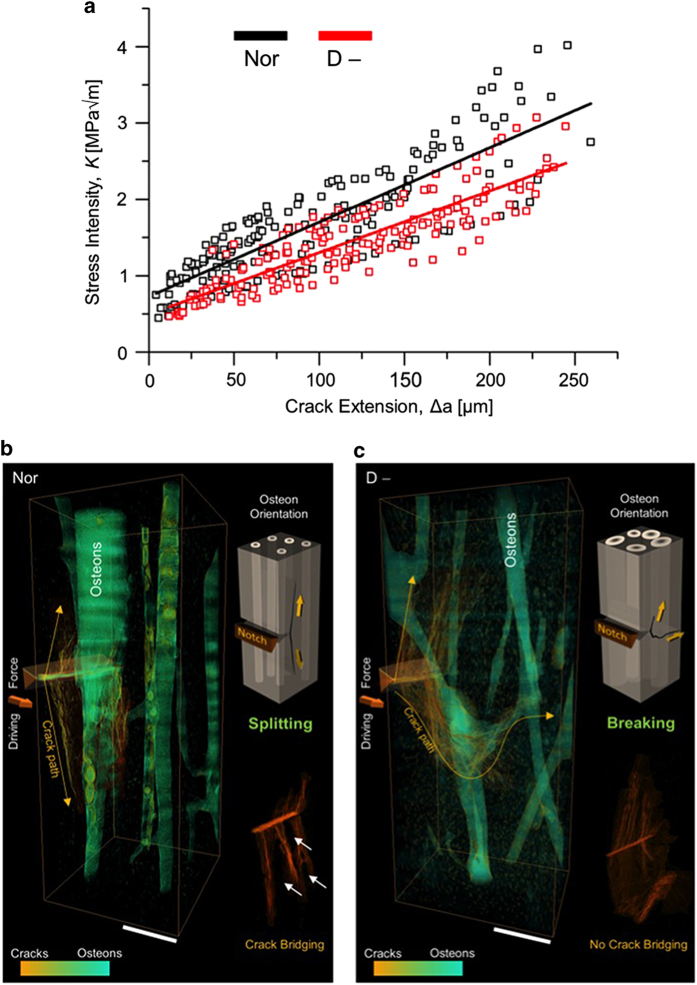
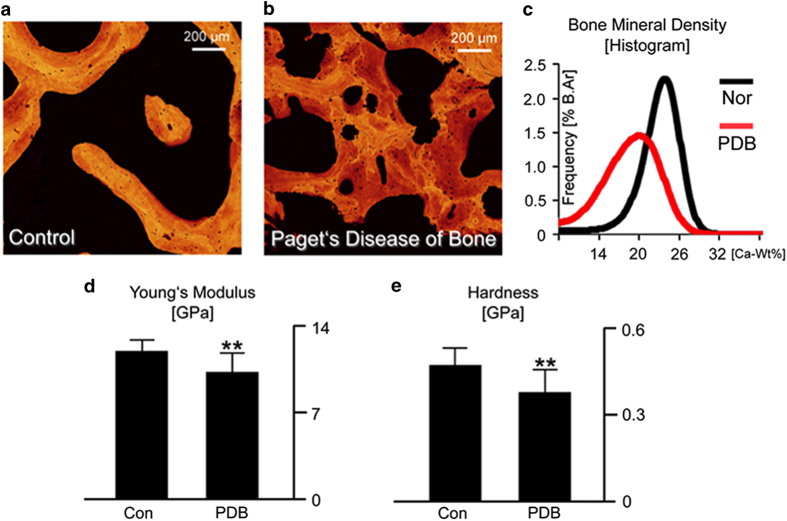
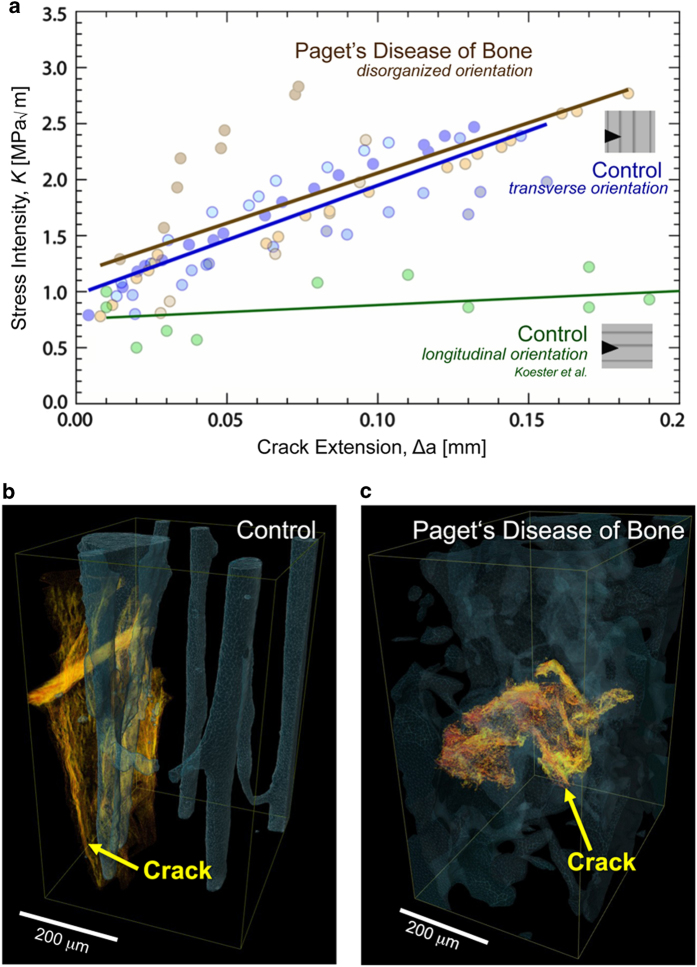
Aging and bone diseases are associated with increased fracture risk. It is therefore pertinent to seek an understanding of the origins of such disease-related deterioration in bone's mechanical properties. The mechanical integrity of bone derives from its hierarchical structure, which in healthy tissue is able to resist complex physiological loading patterns and tolerate damage. Indeed, the mechanisms through which bone derives its mechanical properties make fracture mechanics an ideal framework to study bone's mechanical resistance, where crack-growth resistance curves give a measure of the intrinsic resistance to the initiation of cracks and the extrinsic resistance to the growth of cracks. Recent research on healthy cortical bone has demonstrated how this hierarchical structure can develop intrinsic toughness at the collagen fibril scale mainly through sliding and sacrificial bonding mechanisms that promote plasticity. Furthermore, the bone-matrix structure develops extrinsic toughness at much larger micrometer length-scales, where the structural features are large enough to resist crack growth through crack-tip shielding mechanisms. Although healthy bone tissue can generally resist physiological loading environments, certain conditions such as aging and disease can significantly increase fracture risk. In simple terms, the reduced mechanical integrity originates from alterations to the hierarchical structure. Here, we review how human cortical bone resists fracture in healthy bone and how changes to the bone structure due to aging, osteoporosis, vitamin D deficiency and Paget's disease can affect the mechanical integrity of bone tissue.


Conflict of interest statement

The authors declare no conflict of interest.

Figures

Figure 1
Figure 1
Hierarchical structure of human cortical bone. The structure of bone spans numerous length-scales from the macroscopic whole-bone structure to the nanoscale collagen and mineral components. At the microscale, the bone is composed of osteons that are 170–250 μm in diameter. The osteons have a central vascular channel (60–90 μm diameter60), called the Haversian canal, and a highly mineralized outer boundary, called the cement line (<5 μm thickness). In the osteons, each vascular channel is concentrically surrounded by lamellae (2–9 μm thickness). The lamellae, which are composed of bundles of collagen fibrils, have a twisted plywood arrangement, where neighboring lamellae have different fibril orientations. Certain lamellae may be less organized, and it is here that the osteocytes bone cells reside in lacunae (5–10 μm diameter) and interconnect through canaliculi (100–400 nm in diameter). The fibrils (80–100 nm diameter1) are surrounded by polycrystalline extrafibrillar mineral platelets (5 nm thickness, 50–80 nm width and 40–200 nm length3); the extrafibrillar as well as the intrafibrillar matrix may also contain molecular components, such as non-collagenous proteins or cross-links, promoting the formation of sacrificial bonds. In the fibrils, type I collagen molecules (1.5 nm diameter, 300 nm length) and hydroxyapatite nanocrystals (50 nm width, 25 nm height, 1.5–4 nm thickness) form a composite structure, where arrays of collagen molecules staggered at 67 nm are embedded with nanoplatelets of hydroxyapatite mineral. Adapted from Zimmermann et al. and Milovanovic et al.
Figure 2
Figure 2
Toughening mechanisms in bone. Toughness is a competition between intrinsic and extrinsic toughening mechanisms. The intrinsic mechanisms primarily work ahead of the crack tip to develop plasticity, whereas the extrinsic mechanisms act in the crack wake (that is, after crack extension commences) to resist crack propagation through crack-tip shielding mechanisms. In human cortical bone, the extrinsic toughening mechanisms are primarily developed at large length-scales on the order of 1–100's of microns. Here, the most potent extrinsic toughening mechanisms are crack deflection and twist at cement lines and uncracked ligament bridging; however, collagen fiber bridging and microcracking could also have a role. Intrinsic toughness is developed at small length-scales, less than ∼1 μm. Here, plasticity is generated through sliding mechanisms between fibrils that are facilitated by sacrificial bonds (for example, non-collagenous proteins, cross-links) within the extrafibrillar matrix. Similarly, plasticity could also be generated within the fibril through deformation mechanisms, such as the formation of dilatational bands, which are also facilitated by sacrificial bonding in the intrafibrillar matrix. Adapted from Launey et al.
Figure 3
Figure 3
Crack-briding and crack deflection promote extrinsic toughness. Human cortical bone develops extrinsic toughness on the microstructural scale through (a,b) uncracked ligament bridging and (c,d) crack deflection/twist mechanisms. Using (a) 3-D synchrotron tomography and (b) scanning electron microscopy, uncracked segments of bone (orange arrows) can be observed in the wake of the crack. These uncracked regions of bone tissue, commonly generated by microcracking ahead of the crack tip (red arrows), carry part of the load that would otherwise be used to extend the crack. Similarly, evidence of crack deflection can be viewed (c) on the fracture surface after testing and (d) during a test using the scanning electron microscope. Here, the crack grows from the notch (red arrows). As the crack encounters the interfaces within the bone tissue aligned with the osteons, primarily cement lines, the crack will often deflect or twist (black arrows). Adapted from Zimmermann et al.
Figure 4
Figure 4
Crack-growth resistance behavior in bone. Bone is a damage tolerant material that resists the growth of cracks through its structure. As such, a single value of the toughness at instability does not completely characterize bone's behavior. Instead, the toughness must be assessed as a function of crack extension, which is called a crack-growth resistance-curve or a R-curve. Here, the amplitude of the stress and displacement fields around the crack tip (that is, K, J or G) is measured as the crack stabily extends. With R-curves, the value of the driving force as Δa→0 is a measure of the crack-initiation toughness, whereas the slope of the R-curve is a measure of the crack-growth toughness. The R-curves of human cortical bone have a positive slope, which indicates rising R-curve behavior. Essentially, the slope is able to rise because the toughness of the material increases with crack extension. Here, the microstructural extrinsic toughening mechanisms, such as crack deflection and uncracked ligament bridging, become activated with crack extension and toughen the material. In the presence of such extrinsic (shielding) mechanisms, a higher driving force is required for further crack extension. Adapted from Koester et al. and Zimmermann et al.
Figure 5
Figure 5
Aging-related changes to bone toughness. Aging of human cortical bone affects its mechanical properties at small and large length-scales. (a) In situ small-angle X-ray scattering measurements have shown that the fibrils in aged bone deform less during mechanical tensile tests, which indicates changes in the intrinsic toughness. (b) Indeed, the aged bone has a significantly higher amount of non-enzymatic cross-links. These cross-links, which form between collagen molecules and between fibrils, could constrain deformation in the aged fibrils and reduce plasticity through fibrillar sliding. (c) The aging-related deterioration in mechanical properties is also clear in fracture toughness crack-growth resistance curves. Here, decreases in the crack initiation toughness as well as the crack-growth toughness are evident with aging. Extrinsically, the decrease in the crack-growth toughness stems from the higher osteon density in aged tissue. Using 3-D synchrotron micro-computed tomography on fracture toughness samples after testing of (d) young (34–41 years) and (e) aged (85–99 years) human cortical bone, the higher osteon density and lack of uncracked ligament bridges are evident in the aged tissue. Haversian canals (green) are visible as well as the growing crack (yellow) extending from the notch (white arrow). Uncracked regions spanning the crack wake are found in young bone (orange arrows) but are less apparent and smaller in aged bone. As the osteon density is higher in the aged tissue, the crack bridges will be smaller and closer together causing a lower resistance to crack growth. Adapted from Nalla et al. and Zimmermann et al.
Figure 6
Figure 6
Characteristics of vitamin D-deficient bone at small length-scales. In von Kossa stained histological sections of (a) healthy control (Nor) and (b) vitamin D-deficient human bone (D-), the vitamin D-deficient bone has a greater amount of osteoid (red) covering the mineralized tissue (black), scale bar equals 600 μm. The mineralized tissue trapped within the osteoid frame has a higher mineralization, as measured through 3-D synchrotron X-ray computed microtomography. (c) The histogram shows the distribution of mineralization values in the 3-D volume for each sample. (d) The mean calcium weight % in the histogram is significantly higher in the vitamin D-deficient samples. Fourier transform infrared spectroscopy measurements of the (e) cross-link ratio and the (f) carbonate-to-phosphate ratio were higher in the vitamin D-deficient tissue, which indicates a greater tissue age. Adapted from Busse et al.
Figure 7
Figure 7
Toughness of bone with vitamin D deficiency. (a) Fracture toughness measurements in the form of crack-growth resistance curves were measured in a set of healthy/control (Nor) and vitamin D-deficient (D-) human bone biopsies. The toughness of the vitamin D-deficient samples was lower compared with controls; specifically, a 22% decrease in the crack-initiation toughness and a 31% decrease in the crack-growth toughness were measured. The samples used for toughness testing also exhibited different trends in crack extension observable with 3-D synchrotron computed microtomography. (b) The control samples had a deflected crack path consistent with the behavior of healthy tissue, whereas (c) the vitamin D-deficient samples had a significantly straighter crack path with a 30% smaller deflection angle than the control samples. These changes accounted for the decrease in the fracture toughness in the vitamin D-deficient bone. Adapted from Busse et al.
Figure 8
Figure 8
Characteristics of Paget's disease at small length-scales. Paget's disease of bone affected the composition of the bone structure at small length-scales. The mineral distribution in (a) control and (b) Paget's disease samples was measured with quantitative back-scattered electron imaging. (c) The Paget's disease of bone samples had a lower average Ca-Wt% value and a higher degree of low mineralized bone, as seen from the histogram, which shows the distribution of Ca-Wt% values in the images. These changes in composition at the nanoscale have a direct result on the mechanical properties. Nanoindentation was used to measure the (d) Young's modulus and (e) hardness of the control and diseased cases. Here, the disease samples have a lower stiffness, due to the lower mineralization, as well as a lower hardness, which measures the resistance to plastic deformation. Adapted from Zimmermann et al.
Figure 9
Figure 9
Toughness of bone with Paget's disease. (a) The toughness of control and Paget's disease of bone samples was measured as a function of crack extension. Despite the marked changes in the bone structure at small and large length-scales in Paget's disease of bone, the diseased tissue was not significantly different from healthy/control samples. 3-D synchrotron X-ray computed microtomography was used to investigate the crack path (yellow) through the Haversian canal structure (blue) after toughness testing. (b) The control samples exhibited crack deflection, which is known to extrinsically increase the toughness in bone. (c) However, the diseased bone displayed much straighter crack paths. As the diseased bone did not exhibit much crack deflection, we believe that the comparable toughness in the Paget's diseased bone is derived from the increase in plasticity and possibly due to its lower mineralization, which is consistent with the occurrence of stable fractures found in clinical cases. Adapted from Zimmermann et al.

References

    1. Weiner S, Wagner HD. The material bone: structure mechanical function relations. Annu Rev Mater Sci 1998; 28: 271–298.
    1. Arsenault A. Image-analysis of collagen-associated mineral distribution in cryogenically prepared turkey leg tendons. Calcif Tissue Int 1991; 48: 56–62. - PubMed
    1. McNally EA, Schwarcz HP, Botton GA, Arsenault AL. A model for the ultrastructure of bone based on electron microscopy of ion-milled sections. PLoS One 2012; 7: e29258. - PMC - PubMed
    1. Robins SP. Biochemistry and functional significance of collagen cross-linking. Biochem Soc Trans 2007; 35: 849–852. - PubMed
    1. Thurner PJ, Katsamenis OL. The role of nanoscale toughening mechanisms in osteoporosis. Curr Osteoporos Rep 2014; 12: 351–356. - PubMed