

doi: 10.1002/psp4.55.
Epub 2015 Jul 14.
Organ Impairment-Drug-Drug Interaction Database: A Tool for Evaluating the Impact of Renal or Hepatic Impairment and Pharmacologic Inhibition on the Systemic Exposure of Drugs
Affiliations
- PMID: 26380158
- PMCID: PMC4562165
- DOI: 10.1002/psp4.55
Item in Clipboard
Organ Impairment-Drug-Drug Interaction Database: A Tool for Evaluating the Impact of Renal or Hepatic Impairment and Pharmacologic Inhibition on the Systemic Exposure of Drugs
CPT Pharmacometrics Syst Pharmacol.
2015 Aug.
Abstract
The organ impairment and drug-drug interaction (OI-DDI) database is the first rigorously assembled database of pharmacokinetic drug exposure data from publicly available renal and hepatic impairment studies presented together with the maximum change in drug exposure from drug interaction inhibition studies. The database was used to conduct a systematic comparison of the effect of renal/hepatic impairment and pharmacologic inhibition on drug exposure. Additional applications are feasible with the public availability of this database.
Figures
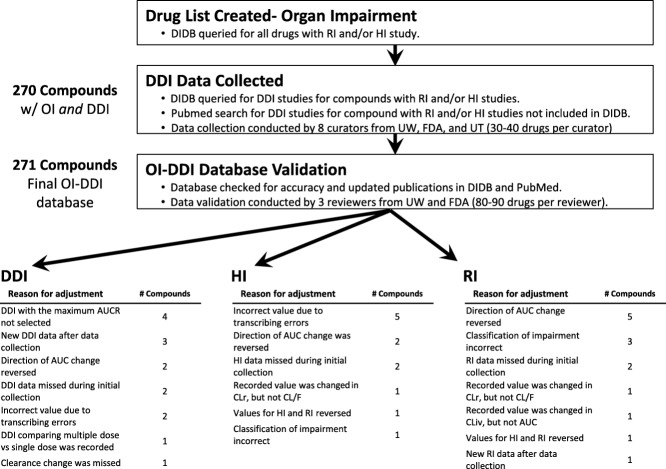
Flowchart of the database construction and validation processes. AUC, area under the concentration-time curve; CL, clearance; CLiv, clearance after intravenous administration; CLr, renal clearance; DDI, drug–drug interaction; DIDB, Drug Interaction Database; F, absolute bioavailability; FDA, Food and Drug Administration; HI, hepatic impairment; OI, organ impairment; RI, renal impairment; UT, University of Tokyo; UW, University of Washington.
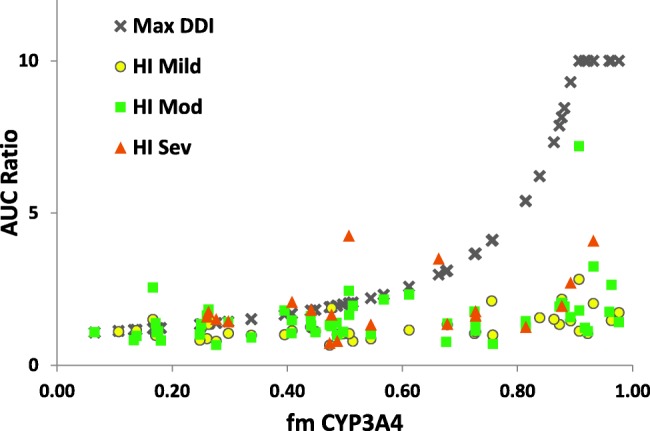
Relationship between fm,CYP3A4 and observed AUC ratios with various degrees of HI or maximum AUC ratios with DDIs. Each symbol represents AUC ratios for one compound in corresponding conditions. "Max DDI" represents the maximum AUC ratio in all the DDIs reported for each compound. All AUC ratio values >10 are shown on the graph as AUC = 10. AUC, area under the concentration–time curve; fm,CYP3A4, fraction of dose metabolized by CYP3A4; HI, hepatic impairment.
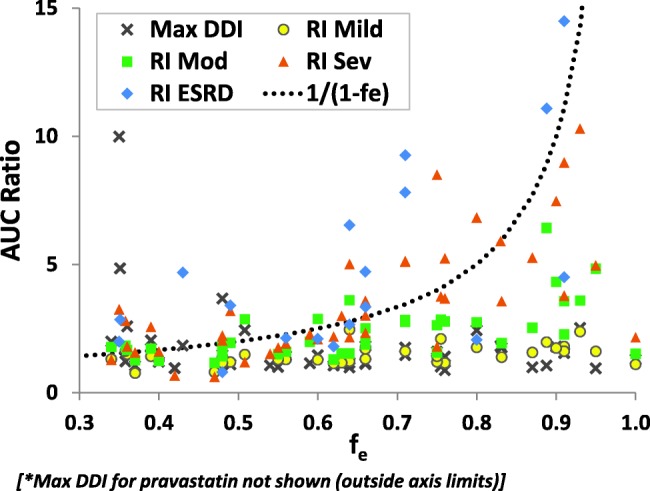
Relationships between fe (fe,iv or fe,po/F) and observed AUCR with various degrees of RI or maximum AUC ratios with DDIs for compounds with fe ≥ 0.3. Each symbol represents AUCR for one compound in corresponding conditions. "Max DDI" represents the maximum AUCR in all the DDIs reported for each compound. The dotted lines represent theoretical maximum AUC ratios by assuming complete block of renal elimination, calculated by 1/(1-fe). AUC, area under the concentration–time curve; F, absolute bioavailability; fe, fraction of dose excreted unchanged into urine; RI, renal impairment.
References
-
- Guidance for Industry: Pharmacokinetics in Patients with Impaired Hepatic Function: Study Design, Data Analysis, and Impact on Dosing and Labeling, U.S. Food and Drug Administration. < http://www.fda.gov/downloads/Drugs/GuidanceComplianceRegulatoryInformati... > (2003). Accessed January 21, 2015.
-
- Draft Guidance for Industry Pharmacokinetics in Patients with Impaired Renal Function — Study Design, Data Analysis, and Impact on Dosing and Labeling, U.S. Food and Drug Adminstration. < http://www.fda.gov/downloads/Drugs/GuidanceComplianceRegulatoryInformati... > (2010). Accessed January 21, 2015.
-
- Guideline on the evaluation of the pharmacokinetics of medicinal products in patients with decreased renal function, European Medicines Agency. < http://www.ema.europa.eu/docs/en_GB/document_library/Scientific_guidelin... > (2014). Accessed January 21, 2015.
-
- Guideline on the Evaluation of the Pharmacokinetics of Medicinal Products in Patients with Impaired Hepatic Function, European Medicine Agency. < http://www.ema.europa.eu/docs/en_GB/document_library/Scientific_guidelin... > (2005). Accessed January 21, 2015.
-
- Goodman and Gilman’s the Pharmacological Basis of Therapeutics. 11th ed. New York, NY: McGraw-Hill; 2006.
LinkOut - more resources
Full Text Sources
Other Literature Sources
