. 2015 Aug 26;8(Suppl 1):99-109.
doi: 10.4137/CMC.S15710. eCollection 2014.

Computational Shape Models Characterize Shape Change of the Left Atrium in Atrial Fibrillation

Affiliations

Computational Shape Models Characterize Shape Change of the Left Atrium in Atrial Fibrillation

Joshua Cates et al. Clin Med Insights Cardiol. .

Abstract

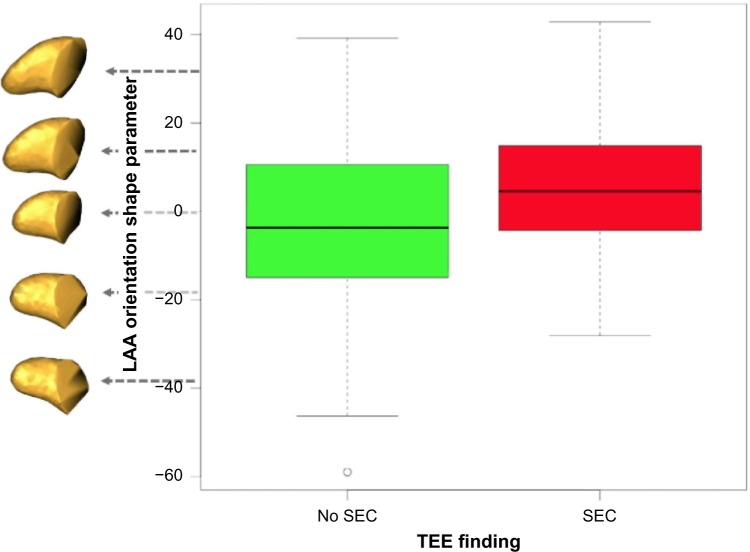
Shape change of the left atrium (LA) and LA appendage in atrial fibrillation (AF) patients is hypothesized to be linked to AF pathology and to play a role in thrombogenesis; however, many aspects of shape variation in the heart are poorly understood. To date, studies of the LA shape in AF have been limited to empirical observation and summary metrics, such as volume and its likeness to a sphere. This paper describes a more comprehensive approach to the study of the LA shape through the use of computationally derived statistical shape models. We describe practical approaches that we have developed to extract shape parameters automatically from the three-dimensional MR images of the patient. From these images and our techniques, we can produce a more comprehensive description of LA geometric variability than that has been previously possible. We present the methodology and results from two examples of specific analyses using shape models: (1) we describe statistically significant group differences between the normal control and AF patient populations (n = 137) and (2) we describe characteristic shapes of the LA appendage that are associated with the risk of thrombogenesis determined by transesophageal echocardiography (n = 203).

Keywords: atrial fibrillation; cardiac MRI; left atrium; left-atrial appendage; morphometrics; statistical shape modeling.


Figures

Figure 1
Figure 1
MRA and LGE-MRI of the LA. (A) A single slice from a 3D MRA sequence of the LA, showing the endocardial boundaries of the LA, the antrum of the RIPV, and the AO. (B) A co-registered slice from the subsequent 3D LGE-MRI sequence of the LA wall, showing enhancement in the LA wall.
Figure 2
Figure 2
An example of LA segmentation from the MRA and LGE-MRI. (A) A single slice from a segmentation of the LA wall (LGE-MRI). (B) A surface rendering of the LA segmentation, showing attached PVs, MV, and the LAA.
Figure 3
Figure 3
Distribution by group of the AP-dilation shape parameter. Reconstructed LA shapes described by this parameter are shown in the left. Note that control shapes tend to cluster at the positive, less-dilated end of the spectrum, while AF shapes cluster at the negative, more-dilated end, with persistent AF showing more strongly negative values. (Note that the units are not physical units, but units of the PCA shape parameter.)
Figure 4
Figure 4
Shape variation described by the AP-dilation shape parameter. Two views of reconstructed LA shapes along a spectrum of ±3 standard deviations (σ) from the mean. The dilation is clearly visible in the inferior view. Positions of the average shapes in each group are also shown.
Figure 5
Figure 5
Correlation of LA volume with the AP-dilation shape parameter. Volume correlates with shape in the entire cohort and with the control group, but is not correlated with shape in the paroxysmal and persistent AF groups.
Figure 6
Figure 6
The LAA length shape parameter describes significant group differences between patients where SEC is present in TEE examinations and those where no SEC is found, P = 0.028. Longer, thinner LAA shapes tend to show more SEC than shorter, thicker shapes. (Note that units are not physical units, but units of the PCA shape parameter.).
Figure 7
Figure 7
Shape variation of the LAA that describes significant group differences between SEC and non-SEC TEE findings. Reconstructed LAA shapes along a spectrum of ±2 standard deviations (σ) from the mean for the first (“length”) shape parameter (top row) and the second (“orientation”) shape parameter.
Figure 8
Figure 8
The LAA orientation shape parameter describes significant group differences between patients where SEC is present in TEE examinations and those where no SEC is found, P = 0.0004. LAA that are curved anteriorly tend to show more SEC than shapes that extend straight in a left-superior direction. (Note that units are not physical units, but units of the PCA shape parameter.)

References

    1. Miyasaka Y, Barnes ME, Gersh BJ, et al. Secular trends in incidence of atrial fibrillation in Olmsted County, Minnesota, 1980 to 2000, and implications on the projections for future prevalence. Circulation. 2006;114:119–25. - PubMed
    1. Benjamin EJ, Levy D, Vaziri SM, D’Agostino RB, Belanger AJ, Wolf PA. Independent risk factors for atrial fibrillation in a population-based cohort. JAMA. 1994;271:840–4. - PubMed
    1. Wolf Philip A, Abbott Robert D, Kannel William B. Atrial fibrillation as an independent risk factor for stroke: the Framingham study. Stroke. 1991;22:983–8. - PubMed
    1. Chimowitz MI, DeGeorgia MA, Poole RM, Hepner A, Armstrong WM. Left atrial spontaneous echo contrast is highly associated with previous stroke in patients with atrial fibrillation or mitral stenosis. Stroke. 1993;24:1015–9. - PubMed
    1. Al-Saady NM, Obel OA, Camm AJ. Left atrial appendage: structure, function, and role in thromboembolism. Heart. 1999;82:547–54. - PMC - PubMed

LinkOut - more resources