

A comparison of alternative strategies for choosing control populations in observational studies
- PMID: 26380564
- PMCID: PMC4565881
- DOI: 10.1007/s10742-014-0135-8
A comparison of alternative strategies for choosing control populations in observational studies
Abstract
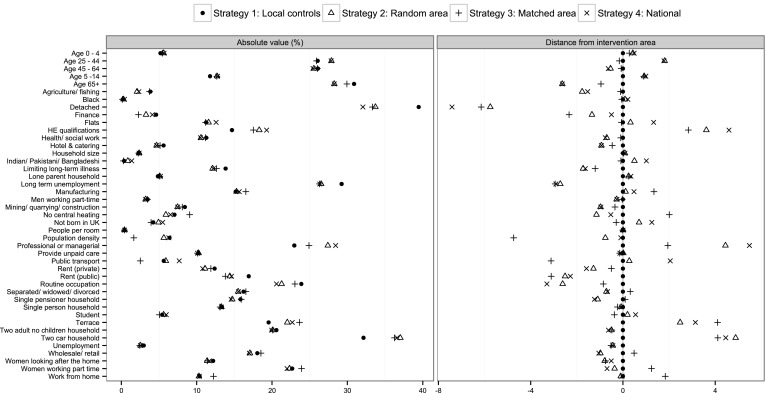
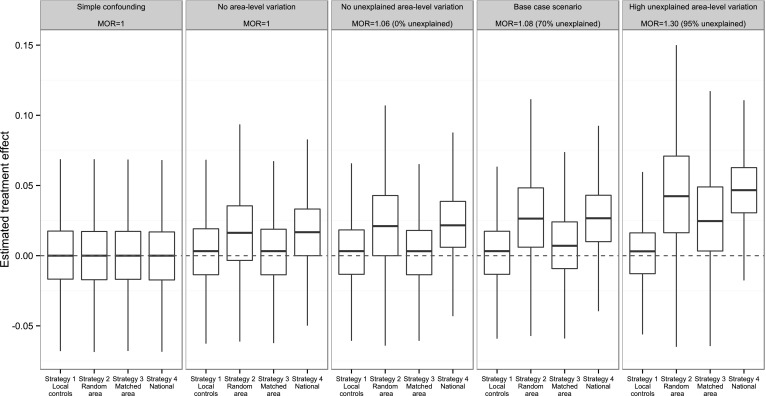
Various approaches have been used to select control groups in observational studies: (1) from within the intervention area; (2) from a convenience sample, or randomly chosen areas; (3) from areas matched on area-level characteristics; and (4) nationally. The consequences of the decision are rarely assessed but, as we show, it can have complex impacts on confounding at both the area and individual levels. We began by reanalyzing data collected for an evaluation of a rapid response service on rates of unplanned hospital admission. Balance on observed individual-level variables was better with external than local controls, after matching. Further, when important prognostic variables were omitted from the matching algorithm, imbalances on those variables were also minimized using external controls. Treatment effects varied markedly depending on the choice of control area, but in the case study the variation was minimal after adjusting for the characteristics of areas. We used simulations to assess relative bias and means-squared error, as this could not be done in the case study. A particular feature of the simulations was unexplained variation in the outcome between areas. We found that the likely impact of unexplained variation for hospital admissions dwarfed the benefits of better balance on individual-level variables, leading us to prefer local controls in this instance. In other scenarios, in which there was less unexplained variation in the outcome between areas, bias and mean-squared error were optimized using external controls. We identify some general considerations relevant to the choice of control population in observational studies.
Keywords: Program evaluation; Propensity score matching; Quasi-experiments.
Figures
References
-
- Abadie A, Diamond A, Hainmueller J. Synthetic control methods for comparative case studies: estimating the effect of California’s tobacco control program. J. Am. Stat. Assoc. 2010;105:493–505. doi: 10.1198/jasa.2009.ap08746. - DOI
-
- Abadie A, Imbens GW. A Martingale representation for matching estimators. J. Am. Stat. Assoc. 2012;107:833–843. doi: 10.1080/01621459.2012.682537. - DOI
LinkOut - more resources
Full Text Sources
Other Literature Sources