. 2015 Jul 25:10:45.
doi: 10.1186/s40793-015-0034-9. eCollection 2015.

Toward a standard in structural genome annotation for prokaryotes

Affiliations

Toward a standard in structural genome annotation for prokaryotes

H James Tripp et al. Stand Genomic Sci. .

Abstract

Background: In an effort to identify the best practice for finding genes in prokaryotic genomes and propose it as a standard for automated annotation pipelines, 1,004,576 peptides were collected from various publicly available resources, and were used as a basis to evaluate various gene-calling methods. The peptides came from 45 bacterial replicons with an average GC content from 31 % to 74 %, biased toward higher GC content genomes. Automated, manual, and semi-manual methods were used to tally errors in three widely used gene calling methods, as evidenced by peptides mapped outside the boundaries of called genes.

Results: We found that the consensus set of identical genes predicted by the three methods constitutes only about 70 % of the genes predicted by each individual method (with start and stop required to coincide). Peptide data was useful for evaluating some of the differences between gene callers, but not reliable enough to make the results conclusive, due to limitations inherent in any proteogenomic study.

Conclusions: A single, unambiguous, unanimous best practice did not emerge from this analysis, since the available proteomics data were not adequate to provide an objective measurement of differences in the accuracy between these methods. However, as a result of this study, software, reference data, and procedures have been better matched among participants, representing a step toward a much-needed standard. In the absence of sufficient amount of exprimental data to achieve a universal standard, our recommendation is that any of these methods can be used by the community, as long as a single method is employed across all datasets to be compared.


Figures
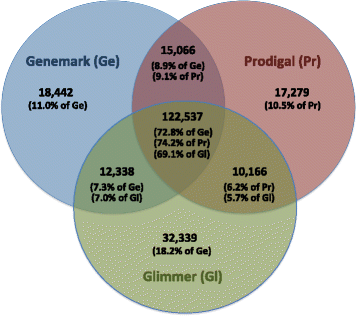
Fig. 1
Fig. 1
Overlaps between the sets of identical genes predicted by the three ab initio gene callers for 52 genomes. Gene predictions by two gene callers coincide only if both of their start and stop codons are predicted to be in the same positions on the same strand. The numerator for the percentages reported on the diagram is the number of relevant calls, which appears above the percentage. The denominator for the percentages is the total number of calls made by the gene caller, whose abbreviation appears after the percentage. Ge, GeneMark; Gl, Glimmer; Pr, Prodigal
Fig. 2
Fig. 2
Overview of all gene calling errors by gene calling method. The number of gene calling errors found in the entire data set, by type, are plotted by gene calling method
Fig. 3
Fig. 3
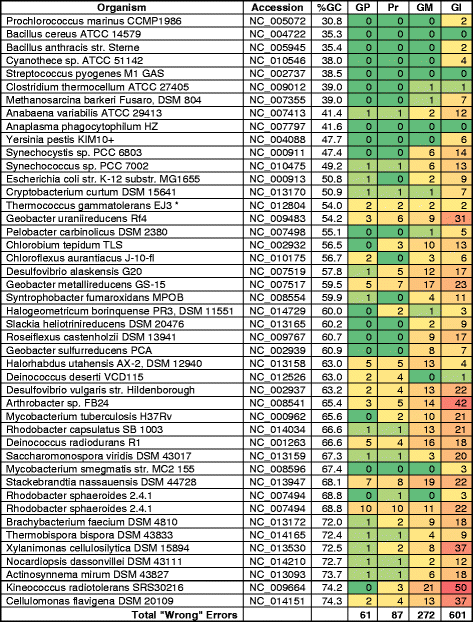
Total wrongly predicted (annotated) genes. GP, GenePRIMP; Pr, Prodigal; GM, GeneMarkS; Gl, Glimmer3
Fig. 4
Fig. 4
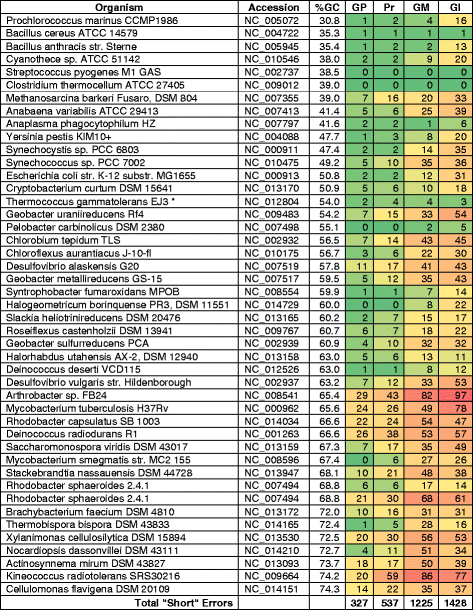
Genes with starts predicted downstream from detected starts (as indicated by proteomics). GP, GenePRIMP; Pr, Prodigal; GM, GeneMarkS; Gl, Glimmer3
Fig. 5
Fig. 5
Genes missed by gene prediction (annotation) methods. Pr, Prodigal; GP, GenePRIMP; GM, GeneMarkS; Gl, Glimmer3
Fig. 6
Fig. 6
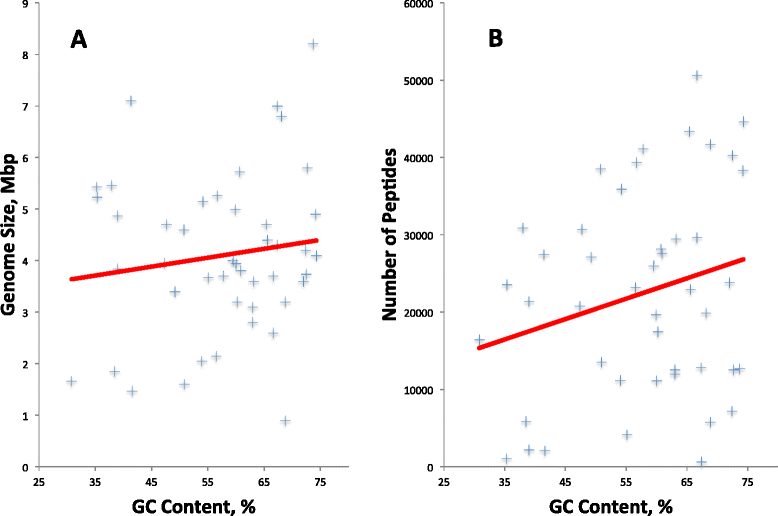
Bias toward increased genome length and number of peptides with increased GC content. a. The genome length in Mbp is plotted against GC content of replicons used. b. The number of peptides is plotted against GC content of replicons used
Fig. 7
Fig. 7
Artemis visualization of peptides refuting incorrect pseudogene call. The three boxes with thick black outlines and yellow backgrounds are CDS fragments of a single gene (DeiRad1_01026) disrupted by two frameshifts. The green boxes represent detected peptides
Fig. 8
Fig. 8
Schematic representation of scoring errors in gene calling. Right and left pointing arrows indicate genes called on positive and negative genome strand respectively. Boxes represent peptides detected by proteomics. Dashed contours show the extension of a gene or missed gene implied by peptide data

References

    1. Reddy TB, Thomas AD, Stamatis D, Bertsch J, Isbandi M, Jansson J, et al. The Genomes OnLine Database (GOLD) v.5: a metadata management system based on a four level (meta)genome project classification. Nucleic Acids Res. 2014, doi: 10.1093/nar/gku950. - PMC - PubMed
    1. Kyrpides NC. Fifteen years of microbial genomics: meeting the challenges and fulfilling the dream. Nat Biotechnol. 2009;27(7):627–32. doi: 10.1038/nbt.1552. - DOI - PubMed
    1. Tanner S, Shen Z, Ng J, Florea L, Guigó R, Briggs SP, et al. Improving gene annotation using peptide mass spectrometry. Genome Res. 2007;17:231–239. doi: 10.1101/gr.5646507. - DOI - PMC - PubMed
    1. de Souza GA, Softeland T, Koehler CJ, Thiede B, Wiker HG. Validating divergent ORF annotation of the Mycobacterium leprae genome through a full translation data set and peptide identification by tandem mass spectrometry. Proteomics. 2009;9:3233–3243. doi: 10.1002/pmic.200800955. - DOI - PubMed
    1. Zivanovic Y, Armengaud J, Lagorce A, Leplat C, Guérin P, Dutertre M, et al. Genome analysis and genome-wide proteomics of Thermococcus gammatolerans, the most radioresistant organism known amongst the Archaea. Genome Biol. 2009;10:R70. doi: 10.1186/gb-2009-10-6-r70. - DOI - PMC - PubMed

LinkOut - more resources