

The challenge of accurately documenting bee species richness in agroecosystems: bee diversity in eastern apple orchards
- PMID: 26380684
- PMCID: PMC4567859
- DOI: 10.1002/ece3.1582
The challenge of accurately documenting bee species richness in agroecosystems: bee diversity in eastern apple orchards
Abstract
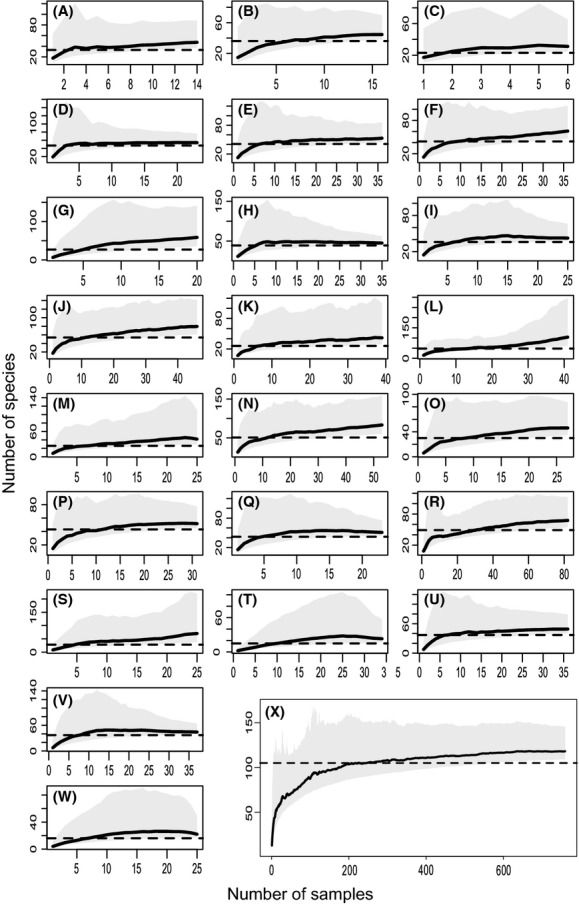
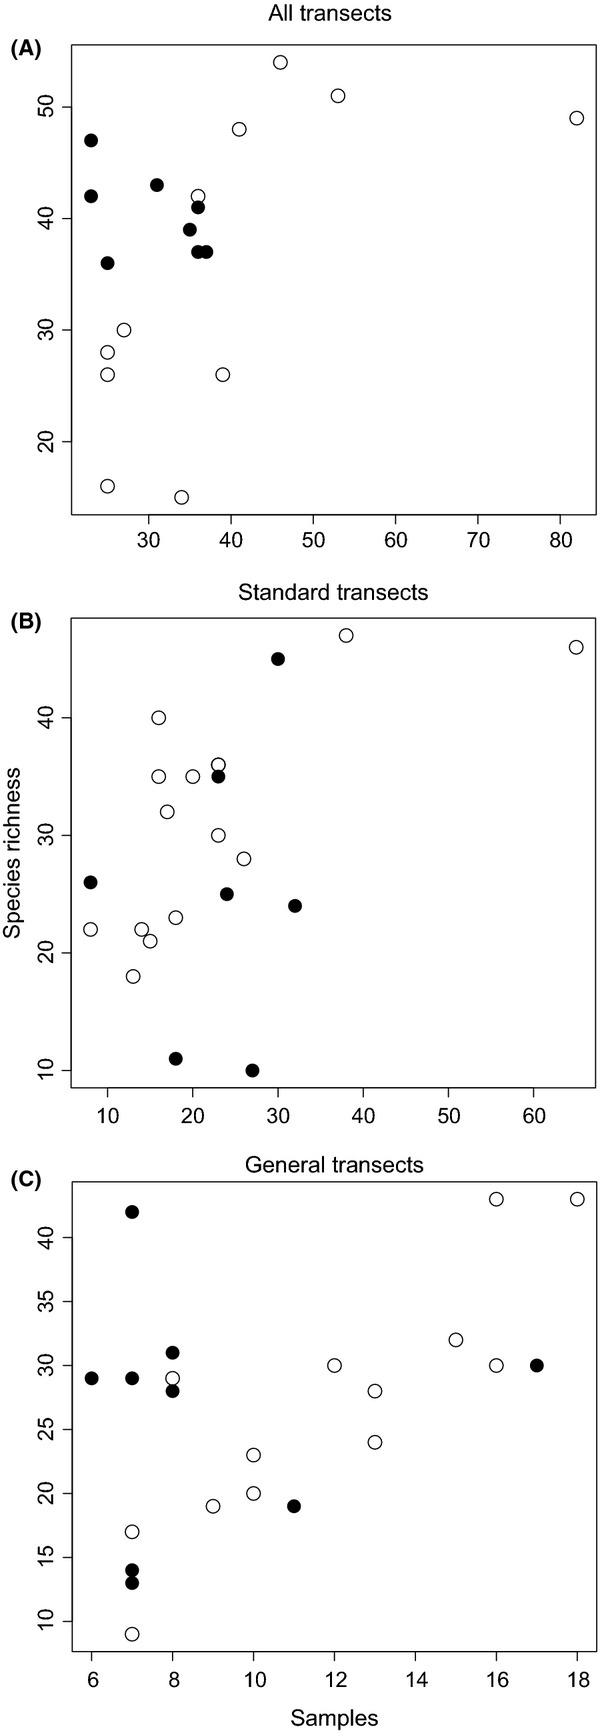
Bees are important pollinators of agricultural crops, and bee diversity has been shown to be closely associated with pollination, a valuable ecosystem service. Higher functional diversity and species richness of bees have been shown to lead to higher crop yield. Bees simultaneously represent a mega-diverse taxon that is extremely challenging to sample thoroughly and an important group to understand because of pollination services. We sampled bees visiting apple blossoms in 28 orchards over 6 years. We used species rarefaction analyses to test for the completeness of sampling and the relationship between species richness and sampling effort, orchard size, and percent agriculture in the surrounding landscape. We performed more than 190 h of sampling, collecting 11,219 specimens representing 104 species. Despite the sampling intensity, we captured <75% of expected species richness at more than half of the sites. For most of these, the variation in bee community composition between years was greater than among sites. Species richness was influenced by percent agriculture, orchard size, and sampling effort, but we found no factors explaining the difference between observed and expected species richness. Competition between honeybees and wild bees did not appear to be a factor, as we found no correlation between honeybee and wild bee abundance. Our study shows that the pollinator fauna of agroecosystems can be diverse and challenging to thoroughly sample. We demonstrate that there is high temporal variation in community composition and that sites vary widely in the sampling effort required to fully describe their diversity. In order to maximize pollination services provided by wild bee species, we must first accurately estimate species richness. For researchers interested in providing this estimate, we recommend multiyear studies and rarefaction analyses to quantify the gap between observed and expected species richness.
Keywords: Agroecosystem; apple orchard; bee diversity; biodiversity; ecosystem function; pollination services; sampling.
Figures
References
-
- Aizen MA. Harder LD. The global stock of domesticated honey bees is growing slower than agricultural demand for pollination. Curr. Biol. 2009;19:915–918. - PubMed
-
- Balvanera P, Pfisterer AB, Buchmann N, He J-S, Nakashizuka T, Raffaelli D, et al. Quantifying the evidence for biodiversity effects on ecosystem functioning and services. Ecol. Lett. 2006;9:1146–1156. - PubMed
-
- Bartomeus I, Park MG, Gibbs J, Danforth BN, Lakso AN. Winfree R. Biodiversity ensures plant–pollinator phenological synchrony against climate change. Ecol. Lett. 2013;16:1331–1338. - PubMed
-
- Blüthgen N. Klein A-M. Functional complementarity and specialisation: the role of biodiversity in plant–pollinator interactions. Basic Appl. Ecol. 2011;12:282–291.
LinkOut - more resources
Full Text Sources
Other Literature Sources
Molecular Biology Databases
Miscellaneous
