. 2015 Sep 17;16(1):195.
doi: 10.1186/s13059-015-0762-6.

Tools and best practices for data processing in allelic expression analysis

Affiliations

Tools and best practices for data processing in allelic expression analysis

Stephane E Castel et al. Genome Biol. .

Abstract

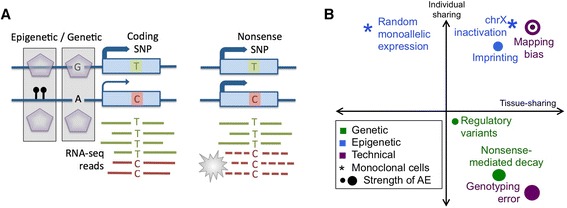
Allelic expression analysis has become important for integrating genome and transcriptome data to characterize various biological phenomena such as cis-regulatory variation and nonsense-mediated decay. We analyze the properties of allelic expression read count data and technical sources of error, such as low-quality or double-counted RNA-seq reads, genotyping errors, allelic mapping bias, and technical covariates due to sample preparation and sequencing, and variation in total read depth. We provide guidelines for correcting such errors, show that our quality control measures improve the detection of relevant allelic expression, and introduce tools for the high-throughput production of allelic expression data from RNA-sequencing data.


Figures

Fig. 1
Fig. 1
Allelic expression and its sources. a Schematic illustration of AE. b Biological sources of AE, with the x-axis denoting the approximate sharing of AE across tissues of an individual, and the y-axis having the estimated sharing of AE signal in one tissue across different individuals [5, 8, 12, 13, 15]. SNP single-nucleotide polymorphism
Fig. 2
Fig. 2
Genomic coverage of AE data in Geuvadis CEU samples. a Cumulative distribution of RNA-seq read coverage per het-SNP (each line represents one sample). b, c The number of het-SNPs (b) and protein-coding genes (c) per sample as a function of coverage cutoff. d The number of protein-coding genes with AE data versus the number of het-SNPs they contain. Each line is the median for all samples at a specific coverage level
Fig. 3
Fig. 3
Strategies for reducing mapping bias in AE analysis. a Summary of various strategies to correct for mapping bias (Baseline = STAR aligned only, Filtering = STAR aligned with bias and mappability filters, P. Genome = STAR aligned to a personalized genome generated with Allele-Seq, WASP = STAR aligned with removal of biased reads using WASP, Variant Aware = GSNAP in variant aware alignment mode). The boxplot (axis on the left) shows reference ratios for AE sites covered by eight or more reads. The mean reference ratio for each strategy is shown with a white dash; the solid black line indicates a reference ratio of 0.5, while dotted lines indicate ±0.05. The percentages of sites that are monoallelic reference (grey circle) or alternative (grey diamond) are plotted against the secondary axis. The number of sites with AE data for each strategy is shown as a percentage of the baseline strategy underneath their respective labels. Outliers are hidden for ease of viewing. b Percentage of sites that are removed when bias and mappability filters are applied to resulting data from all strategies, shown for each reference ratio bin
Fig. 4
Fig. 4
Quality control of genotype data for AE analysis. a Median percentage of het-SNPs where RNA-seq reads from both alleles are observed across all tissues for GTEx samples, genotyped with different platforms: exome-seq (yellow), Illumina OMNI 5 M SNP array (blue), and sites imputed from OMNI 5 M genotype array (red). Grey arrowheads indicate outlier individuals that are likely to have lower genotype quality. b Total het-SNP read count versus the read count of the lesser-covered allele for an individual Geuvadis sample. Sites flagged as putative genotyping errors are marked in red, with RNA-seq data not rendering support for heterozygosity
Fig. 5
Fig. 5
Technical covariates of AE. a Correlation of AE with technical covariates, measured as correlation (R2) between each covariate and the percentage of significant AE sites in a sample (binomial p < 0.05, het-SNPs with ≥30 reads), both before and after scaling to 30 reads. b Correlation of gene expression with technical covariates. As the gene expression statistic we use the median correlation of each sample to all other samples (D-statistic). Correlation to a biological covariate (population) is shown for comparison. Correlations were calculated from all Geuvadis samples by Spearman correlation for continuous covariates, or linear regression for categorical covariates. **p < 0.01, *p < 0.05, after Bonferroni correction. RIN RNA integrity number, Stdev standard deviation
Fig. 6
Fig. 6
QC measures reduce false positives, demonstrated with a binomial test for allelic imbalance. a QQ plot of p values generated from binomial testing after various QC measures. Baseline = STAR aligned testing against a null of 0.5 without any correction for double counting, mapping bias, or genotyping error; No Double Counting = as Baseline but without duplicates and overlapping mate pairs counted once; Site Filter = as No Double Counting but without biased and low mappability het-SNPs; Adjusted Null = As Site Filter but using mean per base reference ratio as the binomial null; WASP Filter = as Site Filter but with WASP filtering of reads; Monoallelic Filter = as Adjusted Null but removing monoallelic sites to account for putative genotyping error. b Histogram showing distribution of coverage for sites with significant (5 % FDR) allelic imbalance according to a binomial test (primary axis), and the percentage of all het-SNPs that show significant allelic imbalance in each coverage bin using increasing allelic effect cutoffs (secondary axis). c, d Multidimensional scaling (MDS) clustering of Geuvadis samples based on proportion of sites with significant AE that differs between sample pairs. Samples are colored by sequencing laboratory and labeled by population. If significant sites are assigned based on a simple binomial test (FDR 5 %), the samples cluster first by sequencing laboratory due to lab-specific differences in coverage (c). This effect is mostly removed in (d) by requiring significant sites to have FDR 5 % and effect size > 0.15
Fig. 7
Fig. 7
QC measures improve the power to detect biologically relevant AE at genes that have eQTLs (eGenes), where individuals that are heterozygous for the top eQTL SNP (eSNP) are expected to have more AE than homozygous individuals. Plot of median AE in heterozygous versus homozygous individuals for each eGene, before (a) and after (b) QC measures. Red points indicate a significant (1 % FDR) difference in AE level in the expected direction (AE het > AE homo, true positive), blue points indicate a significant difference in the opposite direction (AE het < AE homo, false positive), and the number of true and false positives is listed. c Boxplot of the percentage of individuals showing allelic imbalance (AE > 0.25) who are either heterozygous or homozygous for the top eQTL at each eGene before and after QC measures. Outliers are hidden for ease of viewing. d Mean percentage of het-SNPs that are found within heterozygous eGenes in bins of AE across individuals before and after QC measures. Error bars represent the standard error of the mean, and asterisks indicate a significant difference (1 % FDR) after applying QC measures for that bin

References

    1. Adoue V, Schiavi A, Light N, Almlöf JC, Lundmark P, Ge B, et al. Allelic expression mapping across cellular lineages to establish impact of non-coding SNPs. Mol Syst Biol. 2014;10:754. doi: 10.15252/msb.20145114. - DOI - PMC - PubMed
    1. Buil A, Brown AA, Lappalainen T, Viñuela A, Davies MN, Zheng H-F, et al. Gene-gene and gene-environment interactions detected by transcriptome sequence analysis in twins. Nat Genet. 2015;47:88–91. doi: 10.1038/ng.3162. - DOI - PMC - PubMed
    1. Ge B, Pokholok DK, Kwan T, Grundberg E, Morcos L, Verlaan DJ, et al. Global patterns of cis variation in human cells revealed by high-density allelic expression analysis. Nat Genet. 2009;41:1216–22. doi: 10.1038/ng.473. - DOI - PubMed
    1. Battle A, Mostafavi S, Zhu X, Potash JB, Weissman MM, McCormick C, et al. Characterizing the genetic basis of transcriptome diversity through RNA-sequencing of 922 individuals. Genome Res. 2014;24:14–24. doi: 10.1101/gr.155192.113. - DOI - PMC - PubMed
    1. Lappalainen T, Sammeth M, Friedländer MR, 't Hoen PAC, Monlong J, Rivas MA, et al. Transcriptome and genome sequencing uncovers functional variation in humans. Nature. 2013;501:506–11. doi: 10.1038/nature12531. - DOI - PMC - PubMed

Publication types