. 2015 Oct 30;290(44):26562-75.
doi: 10.1074/jbc.M115.676130. Epub 2015 Sep 17.

Multiple structural and epigenetic defects in the human leukocyte antigen class I antigen presentation pathway in a recurrent metastatic melanoma following immunotherapy

Affiliations

Multiple structural and epigenetic defects in the human leukocyte antigen class I antigen presentation pathway in a recurrent metastatic melanoma following immunotherapy

Chien-Chung Chang et al. J Biol Chem. .

Abstract

Scant information is available about the molecular basis of multiple HLA class I antigen-processing machinery defects in malignant cells, although this information contributes to our understanding of the molecular immunoescape mechanisms utilized by tumor cells and may suggest strategies to counteract them. In the present study we reveal a combination of IFN-γ-irreversible structural and epigenetic defects in HLA class I antigen-processing machinery in a recurrent melanoma metastasis after immunotherapy. These defects include loss of tapasin and one HLA haplotype as well as selective silencing of HLA-A3 gene responsiveness to IFN-γ. Tapasin loss is caused by a germ-line frameshift mutation in exon 3 (TAPBP(684delA)) along with a somatic loss of the other gene copy. Selective silencing of HLA-A3 gene and its IFN-γ responsiveness is associated with promoter CpG methylation nearby site-α and TATA box, reversible after DNA methyltransferase 1 depletion. This treatment combined with tapasin reconstitution and IFN-γ stimulation restored the highest level of HLA class I expression and its ability to elicit cytotoxic T cell responses. These results represent a novel tumor immune evasion mechanism through impairing multiple components at various levels in the HLA class I antigen presentation pathway. These findings may suggest a rational design of combinatorial cancer immunotherapy harnessing DNA demethylation and IFN-γ response.

Keywords: DNA methylation; antigen presentation; immunotherapy; major histocompatibility complex (MHC); tumor immunology.


Figures

FIGURE 1.
FIGURE 1.
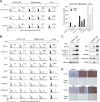
HLA class I molecule down-regulation and antigen-processing machinery component defects in the melanoma cells COPA-159 and in the metastasis from which these cells originated. Shown is FACS analysis of COPA-159 cells surface-stained with HLA class I-specific mAbs (A) or intracellularly stained with HLA class I heavy chain-, β2m-, and antigen-processing machinery component-specific mAbs (B) under basal conditions or after a 72-h treatment with IFN-γ (300 units/ml). The melanocytic strain FOM-101 and B-lymphoid LG-2 cells was used as a normal counterpart and a positive control, respectively. Numbers in plots indicate staining intensity over background (-fold MFI). The right panel of A shows the results (mean ± S.D.) of three independent experiments. Western blot analysis with mAb of COPA-159 cell lysates (C) and immunohistochemical analysis with mAb of sections of the metastasis for HLA class I heavy chain, β2m, and antigen-processing machinery component expression (D). LG-2 cells and tonsil sections were used as positive controls. Irrelevant mouse IgG (Isotype) in D was used as a specificity control. All experiments were performed at least three times with similar results. Scale bars, 50 μm.
FIGURE 2.
FIGURE 2.
A single-nucleotide deletion in TAPBP exon 3 in the melanoma cells COPA-159 and in the metastasis from which these cells originated. A, diagram of TAPBP mRNA structure marked with location of primers (arrows) and the identified premature stop codon (COPA-stop). TAPBP mRNA and its gene status in COPA-159 cells were analyzed by RT-PCR (B) and genomic PCR (C). LG-2 cells were analyzed as a wild-type control. D, the TAPBP nucleotide sequences (nucleotides 669–702) obtained from LG-2 cells, COPA-159 cells, patient PBMC (COPA-159-N), and the tumor lesion (COPA-159-M) were compared in chromatograms. Underlined, location of deletion; boxed, premature stop codon. E, tapasin amino acid residues (position 79 and onward) deduced from wild-type (LG-2) and 684delA (COPA-159) nucleotide sequences were aligned. Blue, missense codons (positions 84∼88); star, premature stop codon (position 89).
FIGURE 3.
FIGURE 3.
LOH at chromosome 6 in the melanoma cells COPA-159 and in the metastatic lesion from which these cells originated. PCR analysis of chromosome 6 in COPA-159 cells (A) and in the tumor lesion (B) using primers specific to 6 short tandem repeat markers, namely, D6S265, D6S276, D6S291, D6S311, D6S1610, and WIAF1587. Patient's PBMC were used as a normal control. C, COPA-159 cells; N, patient's PBMC; M, tumor lesion. Missing alleles are marked by arrowheads. The bottom panel shows % LOH index (mean ± S.D.) versus PBMC (set as 100%) obtained in three independent experiments. *, p < 0.05; **, p < 0.01; ***, p < 0.001 versus PBMC (Student's t test).
FIGURE 4.
FIGURE 4.
HLA class I molecule up-regulation on the melanoma cells COPA-159 after reconstitution of tapasin expression. A, FACS analysis of COPA-159 cells stably transfected with empty vector (COPA-159.neo) or wild-type tapasin cDNA (COPA-159.TPNLow, -fold MFI 5.4, and COPA-159.TPNHigh, -fold MFI 18.4, by intracellular staining) and surface-stained with HLA class I-specific mAbs under basal conditions (continuous line) or after a 72-h treatment with IFN-γ (300 units/ml) (broken line). Numbers in plots indicate staining intensity over background (-fold MFI). B, results of three independent experiments in A were averaged and are presented as relative expression in -fold MFI increase (mean ± S.D.) compared with untreated COPA-159.neo cells *, p < 0.05, **, p < 0.01 (Student's t test). L, low; H, high. C, Western blot analysis of tapasin, TAP1, and TAP2 expression in COPA-159.neo, COPA-159.TPNLow, and COPA-159.TPNHigh cells. Untreated melanocytes were used as a normal control. Actin expression was used as a loading control. Results are representative of three independent experiments.
FIGURE 5.
FIGURE 5.
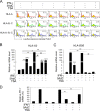
DNMT1 inhibitor 5AdC-mediated re-expression of the HLA-A3 gene and its IFN-γ induced up-regulation on the melanoma cells COPA-159. Shown are FACS analysis of COPA-159 cells stained with HLA class I-specific mAbs (A) and RT-qPCR analysis of COPA-159 cells for HLA-A3 and -B56 and IRF-1 mRNA expression (B, C, and D) under basal conditions and after a 72-h treatment with the indicated combinations of TSA (100 nm), 5AdC (2 μm), and IFN-γ (300 units/ml). Numbers in the plots in A indicate staining intensity over background (-fold MFI). Numbers above the bars in B and C indicate mRNA levels relative to untreated controls. Results are representative of eight, three, four, and three independent experiments in A–D, respectively. *, p < 0.05, **, p < 0.01, versus IFN-γ-treated; ##, p < 0.01, versus combined 5AdC and IFN-γ-treated in B and C; **, p < 0.01, versus combined 5AdC and IFN-γ-treated in D (Student's t test).
FIGURE 6.
FIGURE 6.
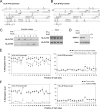
Hypermethylation of HLA-A3 gene promoter in the melanoma cells COPA-159 and in the metastasis from which these cells originated. A and B, the HLA-A3 and HLA-B56 promoter sequence marked with identified CpG sites (numbers) and regulatory elements (gray box) in COPA-159 cells. Regions of −311∼−1 and of −306∼−1 (relative to ATG) are shown for HLA-A3 and HLA-B56, respectively. C, MSP analysis of COPA-159 HLA-A3 and HLA-B56 promoter CpG methylation status under basal conditions and after a 72-h treatment with IFN-γ (300 units/ml), 5AdC (2 μm), or their combination. U, unmethylated; M, methylated. The right panel shows the input promoter fragments (−311∼+3 for HLA-A3; −306∼+3 for HLA-B56) amplified by flanking primers. D, Western blot analysis of COPA-159 cells for DNMT1 expression under basal conditions and after a 72-h treatment with the indicated agents as in C. E and F, pyrosequencing analysis of HLA-A3 (left panels) and HLA-B56 (right panels) promoter CpG methylation status in COPA-159 cells mock-treated versus treated with the indicated agents (E) and in the corresponding tumor lesion versus the patient's PBMC (F). Arrows indicate sites nearby regulatory elements with marked demethylation. Results are expressed as % methylation level (mean ± S.D.) at each CpG site obtained in three independent experiments. *, p < 0.05, **, p < 0.01, versus mock-treated (E) or patient's PBMC (F) (Student's t test).
FIGURE 7.
FIGURE 7.
Enhancement by tapasin transfection combined with 5AdC and IFN-γ treatment of HLA-A3 re-expression on the melanoma cells COPA-159 and of their susceptibility to cognate CTL-mediated cytotoxicity. A, FACS analysis of COPA-159 cells stably transfected with empty vector (COPA-159.neo) or wild-type tapasin cDNA (COPA-159.TPNLow and COPA-159.TPNHigh) and cell surface stained with HLA class I-specific mAbs after a 72-h treatment with IFN-γ (300 units/ml) individually or in combination with 5AdC (2 μm). Numbers in the plots indicate staining intensity over background (-fold MFI). The right panel shows the results (mean ± S.D.) of three independent experiments. B, Western blot analysis of COPA-159 tapasin stable transfectants versus control (COPA-159.neo) for total HLA-A3 and HLA-B and -C heavy chain expression after a 72-h treatment with IFN-γ (300 units/ml) and 5AdC (2 μm). β2m was used as an internal control. C, standard 51Cr-release cytotoxicity assay of COPA-159.neo and COPA-159.TPNHigh cells for their susceptibility to lysis by HLA-A3-restricted, gp10017–25-specific CTLs at the indicated effector-to-target (E:T) ratios under basal conditions and after a 72-h treatment with IFN-γ (300 units/ml) and 5AdC (2 μm) individually or in combination. Results are representative of five independent experiments and are presented as % specific lysis (mean ± S.D.) of triplicate measurements (*, p < 0.05, **, p < 0.01, ***, p < 0.001) versus cells treated with IFN-γ alone in the right panel of A; *, p < 0.05, **, p < 0.01, versus untreated COPA-159.neo cells in C (Student's t test).

References

    1. Hodi F. S., O'Day S. J., McDermott D. F., Weber R. W., Sosman J. A., Haanen J. B., Gonzalez R., Robert C., Schadendorf D., Hassel J. C., Akerley W., van den Eertwegh A. J., Lutzky J., Lorigan P., Vaubel J. M., Linette G. P., Hogg D., Ottensmeier C. H., Lebbé C., Peschel C., Quirt I., Clark J. I., Wolchok J. D., Weber J. S., Tian J., Yellin M. J., Nichol G. M., Hoos A., and Urba W. J. (2010) Improved survival with ipilimumab in patients with metastatic melanoma. N. Engl. J. Med. 363, 711–723 - PMC - PubMed
    1. Hamid O., Robert C., Daud A., Hodi F. S., Hwu W. J., Kefford R., Wolchok J. D., Hersey P., Joseph R. W., Weber J. S., Dronca R., Gangadhar T. C., Patnaik A., Zarour H., Joshua A. M., Gergich K., Elassaiss-Schaap J., Algazi A., Mateus C., Boasberg P., Tumeh P. C., Chmielowski B., Ebbinghaus S. W., Li X. N., Kang S. P., and Ribas A. (2013) Safety and tumor responses with lambrolizumab (anti-PD-1) in melanoma. N. Engl. J. Med. 369, 134–144 - PMC - PubMed
    1. Sharma P., and Allison J. P. (2015) The future of immune checkpoint therapy. Science 348, 56–61 - PubMed
    1. Snyder A., Makarov V., Merghoub T., Yuan J., Zaretsky J. M., Desrichard A., Walsh L. A., Postow M. A., Wong P., Ho T. S., Hollmann T. J., Bruggeman C., Kannan K., Li Y., Elipenahli C., Liu C., Harbison C. T., Wang L., Ribas A., Wolchok J. D., and Chan T. A. (2014) Genetic basis for clinical response to CTLA-4 blockade in melanoma. N. Engl. J. Med. 371, 2189–2199 - PMC - PubMed
    1. Rizvi N. A., Hellmann M. D., Snyder A., Kvistborg P., Makarov V., Havel J. J., Lee W., Yuan J., Wong P., Ho T. S., Miller M. L., Rekhtman N., Moreira A. L., Ibrahim F., Bruggeman C., Gasmi B., Zappasodi R., Maeda Y., Sander C., Garon E. B., Merghoub T., Wolchok J. D., Schumacher T. N., and Chan T. A. (2015) Mutational landscape determines sensitivity to PD-1 blockade in non-small cell lung cancer. Science 348, 124–128 - PMC - PubMed

Publication types

MeSH terms