

Everolimus for subependymal giant cell astrocytoma: 5-year final analysis
- PMID: 26381530
- PMCID: PMC5063160
- DOI: 10.1002/ana.24523
Everolimus for subependymal giant cell astrocytoma: 5-year final analysis
Abstract
Objective: To analyze the cumulative efficacy and safety of everolimus in treating subependymal giant cell astrocytomas (SEGA) associated with tuberous sclerosis complex (TSC) from an open-label phase II study (NCT00411619). Updated data became available from the conclusion of the extension phase and are presented in this ≥5-year analysis.
Methods: Patients aged ≥ 3 years with a definite diagnosis of TSC and increasing SEGA lesion size (≥2 magnetic resonance imaging scans) received everolimus starting at 3mg/m(2) /day (titrated to target blood trough levels of 5-15ng/ml). The primary efficacy endpoint was reduction from baseline in primary SEGA volume.
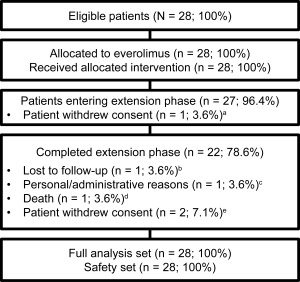
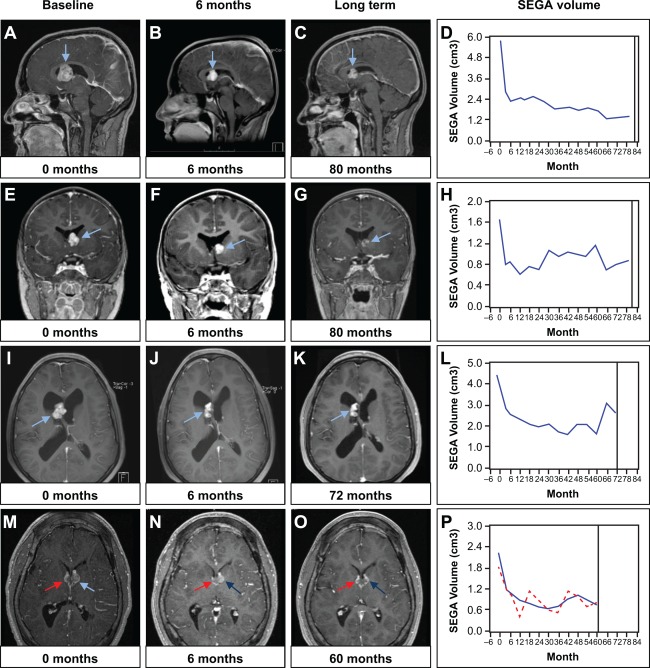
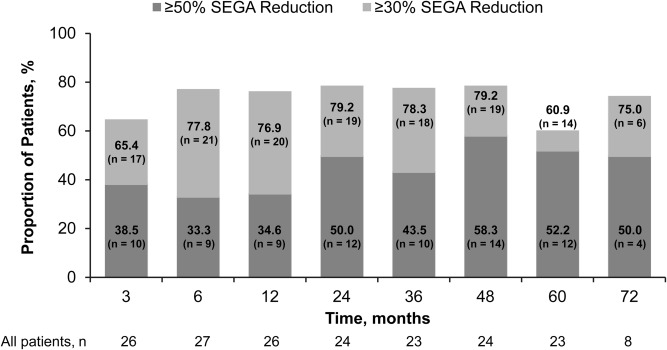
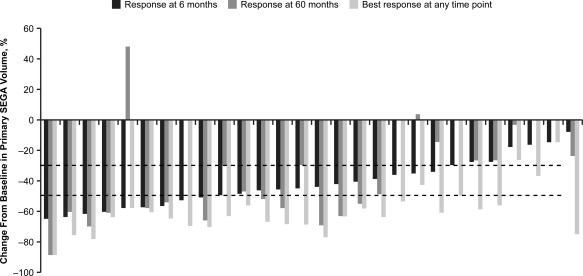
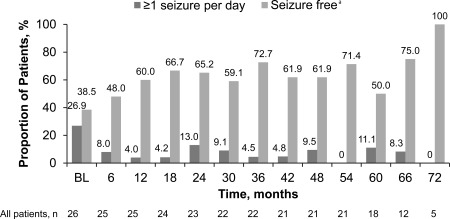
Results: As of the study completion date (January 28, 2014), 22 of 28 (78.6%) initially enrolled patients finished the study per protocol. Median (range) duration of exposure to everolimus was 67.8 (4.7-83.2) months; 12 (52.2%) and 14 (60.9%) of 23 patients experienced SEGA volume reductions of ≥50% and ≥30% relative to baseline, respectively, after 60 months of treatment. The proportion of patients experiencing daily seizures was reduced from 7 of 26 (26.9%) patients at baseline to 2 of 18 (11.1%) patients at month 60. Most commonly reported adverse events (AEs) were upper respiratory tract infection and stomatitis of mostly grade 1 or 2 severity. No patient discontinued treatment due to AEs. The frequency of emergence of most AEs decreased over the course of the study.
Interpretation: Everolimus continues to demonstrate a sustained effect on SEGA tumor reduction over ≥5 years of treatment. Everolimus remained well-tolerated, and no new safety concerns were noted.
© 2015 The Authors. Annals of Neurology published by Wiley Periodicals, Inc. on behalf of American Neurological Association.
Figures
References
-
- Baskin HJ Jr. The pathogenesis and imaging of the tuberous sclerosis complex. Pediatr Radiol 2008;38:936–952. - PubMed
-
- Osborne JP, Fryer A, Webb D. Epidemiology of tuberous sclerosis. Ann N Y Acad Sci 1991;615:125–127. - PubMed
-
- Crino PB, Nathanson KL, Henske EP. The tuberous sclerosis complex. N Engl J Med 2006;355:1345–1356. - PubMed
-
- Goh S, Butler W, Thiele EA. Subependymal giant cell tumors in tuberous sclerosis complex. Neurol 2004;63:1457–1461. - PubMed
Publication types
MeSH terms
Substances
Associated data
LinkOut - more resources
Full Text Sources
Other Literature Sources
Medical
Research Materials
