

Review
doi: 10.1186/s12968-015-0183-4.
Vascular and plaque imaging with ultrasmall superparamagnetic particles of iron oxide
Affiliations
- PMID: 26381872
- PMCID: PMC4574723
- DOI: 10.1186/s12968-015-0183-4
Item in Clipboard
Review
Vascular and plaque imaging with ultrasmall superparamagnetic particles of iron oxide
J Cardiovasc Magn Reson.
.
Abstract
Cardiovascular Magnetic Resonance (CMR) has become a primary tool for non-invasive assessment of cardiovascular anatomy, pathology and function. Existing contrast agents have been utilised for the identification of infarction, fibrosis, perfusion deficits and for angiography. Novel ultrasmall superparamagnetic particles of iron oxide (USPIO) contrast agents that are taken up by inflammatory cells can detect cellular inflammation non-invasively using CMR, potentially aiding the diagnosis of inflammatory medical conditions, guiding their treatment and giving insight into their pathophysiology. In this review we describe the utilization of USPIO as a novel contrast agent in vascular disease.
Figures

Murine blood monocyte in peripheral circulation 48 h after infusion of USPIO. Inlay (bottom right – magnified form black box) demonstrates USPIO within lysosome
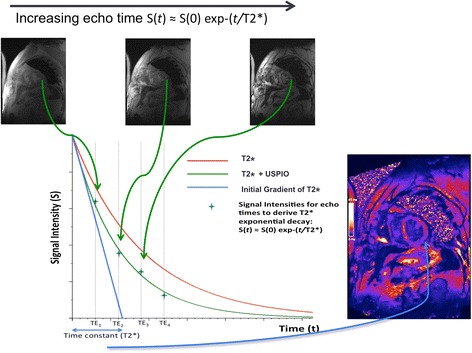
Theoretical T2* exponential decay curves. The T2* curve can be plotted using signal intensities from a region of interest (green crosses) for specific echo times (TEs). In this case, a line of best fit is plotted using the known equation for T2* decay. A T2* map is created from these derived T2* values giving pixel-by-pixel measurements of T2* reported in units of milliseconds, rather than signal intensity of raw images. The red curve describes the decay from pre-USPIO tissue, and the green curved indicated a faster decay due to presence of USPIO. The blue line describes the time constant, T2*

Cardiac T2* Imaging. Multiple images obtained from increasing echo time points (3 time points shown from the left) can be combined to create a T2* map (final image on the right). This map includes the spleen and liver (yellow arrows) and the myocardium (white arrow). These tissues are dark indicating low T2* values consistent with higher USPIO uptake
References
-
- Schelbert EB, Hsu LY, Anderson SA, Mohanty BD, Karim SM, Kellman P, et al. Late gadolinium-enhancement cardiac magnetic resonance identifies postinfarction myocardial fibrosis and the border zone at the near cellular level in ex vivo rat heart. Circ Cardiovasc Imaging. 2010;3:743–52. doi: 10.1161/CIRCIMAGING.108.835793. - DOI - PMC - PubMed
-
- Schiller B, Bhat P, Sharma A, Li Z, Fortin G, McLaughlin J, et al. Safety of Feraheme¬Æ(Ferumoxytol) in hemodialysis patients at 3 dialysis chains over a 1-year period. J Am Soc Nephrol. 2011;22:477A–8.
Publication types
MeSH terms
Substances
Grants and funding
LinkOut - more resources
Full Text Sources
Other Literature Sources
Medical
