. 2015 Sep 17:14:147.
doi: 10.1186/s12934-015-0329-y.

Integrated isotope-assisted metabolomics and (13)C metabolic flux analysis reveals metabolic flux redistribution for high glucoamylase production by Aspergillus niger

Affiliations

Integrated isotope-assisted metabolomics and (13)C metabolic flux analysis reveals metabolic flux redistribution for high glucoamylase production by Aspergillus niger

Hongzhong Lu et al. Microb Cell Fact. .

Abstract

Background: Aspergillus niger is widely used for enzyme production and achievement of high enzyme production depends on the comprehensive understanding of cell's metabolic regulation mechanisms.

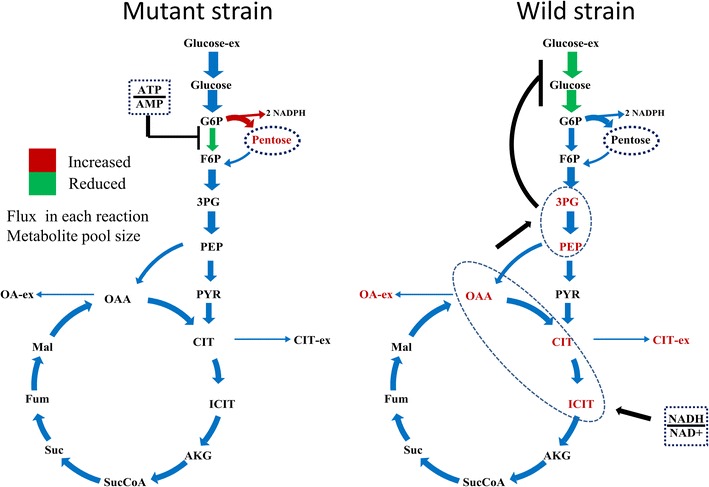
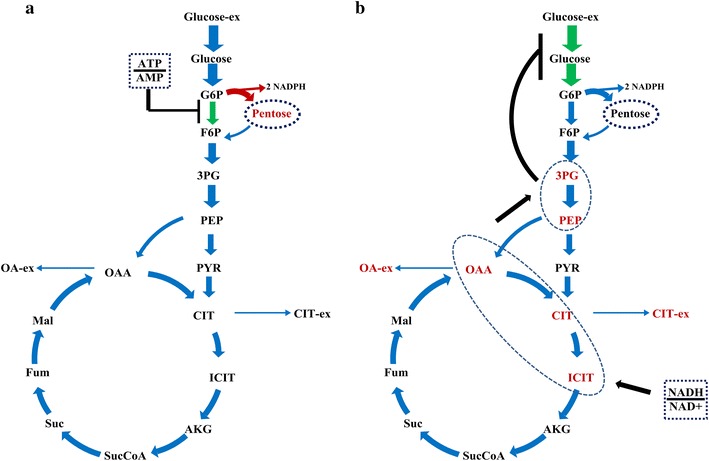
Results: In this paper, we investigate the metabolic differences and regulation mechanisms between a high glucoamylase-producing strain A. niger DS03043 and its wild-type parent strain A. niger CBS513.88 via an integrated isotope-assisted metabolomics and (13)C metabolic flux analysis approach. We found that A. niger DS03043 had higher cell growth, glucose uptake, and glucoamylase production rates but lower oxalic acid and citric acid secretion rates. In response to above phenotype changes, A. niger DS03043 was characterized by an increased carbon flux directed to the oxidative pentose phosphate pathway in contrast to reduced flux through TCA cycle, which were confirmed by consistent changes in pool sizes of metabolites. A higher ratio of ATP over AMP in the high producing strain might contribute to the increase in the PP pathway flux as glucosephosphate isomerase was inhibited at higher ATP concentrations. A. niger CBS513.88, however, was in a higher redox state due to the imbalance of NADH regeneration and consumption, resulting in the secretion of oxalic acid and citric acid, as well as the accumulation of intracellular OAA and PEP, which may in turn result in the decrease in the glucose uptake rate.

Conclusions: The application of integrated metabolomics and (13)C metabolic flux analysis highlights the regulation mechanisms of energy and redox metabolism on flux redistribution in A. niger. Graphical abstract An integrated isotope-assisted metabolomics and (13)C metabolic flux analysis was was firstly systematically performed in A. niger. In response to enzyme production, the metabolic flux in A. niger DS03043 (high-producing) was redistributed, characterized by an increased carbon flux directed to the oxidative pentose phosphate pathway as well as an increased pool size of pentose. The consistency in (13)C metabolic flux analysis and metabolites quantification indicated that an imbalance of NADH formation and consumption led to the accumulation and secretion of organic acids in A. niger CBS513.88 (wild-type).


Figures

Graphical abstract
Graphical abstract
An integrated isotope-assisted metabolomics and 13C metabolic flux analysis was was firstly systematically performed in A. niger. In response to enzyme production, the metabolic flux in A. niger DS03043 (high-producing) was redistributed, characterized by an increased carbon flux directed to the oxidative pentose phosphate pathway as well as an increased pool size of pentose. The consistency in 13C metabolic flux analysis and metabolites quantification indicated that an imbalance of NADH formation and consumption led to the accumulation and secretion of organic acids in A. niger CBS513.88 (wild-type)
Fig. 1
Fig. 1
Physiological profiles of A. niger DS03043 (red line) and CBS513.88 (black line) in batch cultivations. The parameters including OUR (a), CER (b), DO (c), glucose concentration (d), biomass (e), enzyme activity (f), oxalate (g) and citrate (h) for. All parameters were measured based on at least triplicate measurements. The suddenly increased glucose concentration in d represent the pulsed addition of glucose during exponential phase
Fig. 2
Fig. 2
Profiles of enrichment for amino acid fragments in A. niger CBS513.88. The amino acid fragments including ALA-57, ALA-85, ASP-57, ASP-85, GLU-57, GLU-85, SER-57, SER-85, THR-57, THR-85, VAL-57 and VAL-85 after the labeled carbon source was fed into the broth
Fig. 3
Fig. 3
Relative flux (mmol/100 mmol glucose) of A. niger DS03043 (upper) and CBS513.88 (lower). The 68 and 95 % confidence intervals for each reaction and exchange flux values for reversible reactions can be found in Additional file 2. The detailed metabolic model of A. niger and the abbreviation of metabolites could be found in Additional file 4
Fig. 4
Fig. 4
The distribution of metabolites pools between A. niger DS03043 (left column) and CBS513.88 (right column). The bar graphs with black frames indicate the significant difference (P value <0.05) in pool size of metabolites for the two strains. All metabolite pool sizes were measured in at least triplicate measurements. The P values were obtained from two-tailed T test statistical analyses. The upper and lower numbers represent the absolute flux values (mmol/gDCW h) through each reactions in A. niger DS03043 and CBS513.88 respectively
Fig. 5
Fig. 5
The average values of pool size for amino acids from different amino acid families
Fig. 6
Fig. 6
Ratios of ATP/AMP (a), NADH/NAD+ (b) and NADPH/NADP+ (c) in A. niger DS03043 and CBS513.88. The error bars were calculated from error propagation
Fig. 7
Fig. 7
Speculated regulation mechanism revealed by integrated isotope-assisted metabolomics and 13C metabolic flux analysis. Possible effect of the ratio between ATP and AMP on flux redistribution in A. niger DS03043 (a) and regulation mechanism of ratio between NADH and NAD+ on the accumulation of OAA and PER pools, as well as on the specific glucose uptake rates in A. niger CBS513.88 (b). The red color in this graph represent increased flux or metabolites pool size and the green color represent weakened flux

References

    1. Andersen MR, Nielsen J. Current status of systems biology in Aspergilli. Fungal Genet Biol. 2009;46:180–190. doi: 10.1016/j.fgb.2008.07.006. - DOI - PubMed
    1. Meyer V, Wu B, Ram AFJ. Aspergillus as a multi-purpose cell factory: current status and perspectives. Biotechnol Lett. 2011;33:469–476. doi: 10.1007/s10529-010-0473-8. - DOI - PMC - PubMed
    1. Knuf C, Nielsen J. Aspergilli: systems biology and industrial applications. Biotechnol J. 2012;7:1147–1155. doi: 10.1002/biot.201200169. - DOI - PubMed
    1. Ward OP. Production of recombinant proteins by filamentous fungi. Biotechnol Adv. 2012;30:1119–1139. doi: 10.1016/j.biotechadv.2011.09.012. - DOI - PubMed
    1. Sun H, Zhao P, Ge X, Xia Y, Hao Z, Liu J, et al. Recent advances in microbial raw starch degrading enzymes. Appl Biochem Biotechnol. 2010;160:988–1003. doi: 10.1007/s12010-009-8579-y. - DOI - PubMed

Publication types

LinkOut - more resources