. 2015 Nov 1;593(21):4781-97.
doi: 10.1113/JP270252. Epub 2015 Oct 18.

Voltage-gated Ca(2+) influx through L-type channels contributes to sarcoplasmic reticulum Ca(2+) loading in skeletal muscle

Affiliations

Voltage-gated Ca(2+) influx through L-type channels contributes to sarcoplasmic reticulum Ca(2+) loading in skeletal muscle

Gaëlle Robin et al. J Physiol. .

Abstract

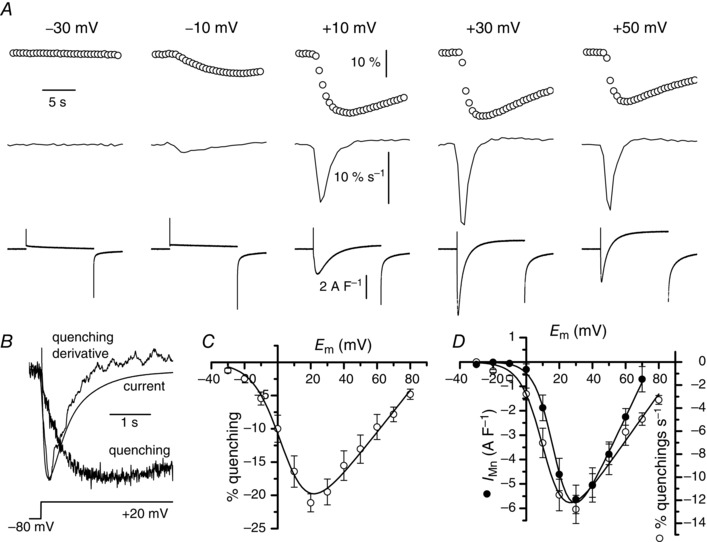
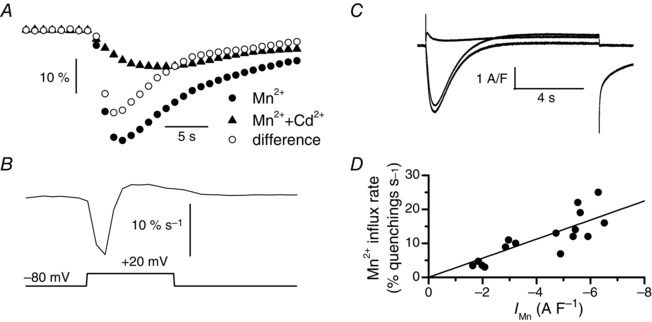
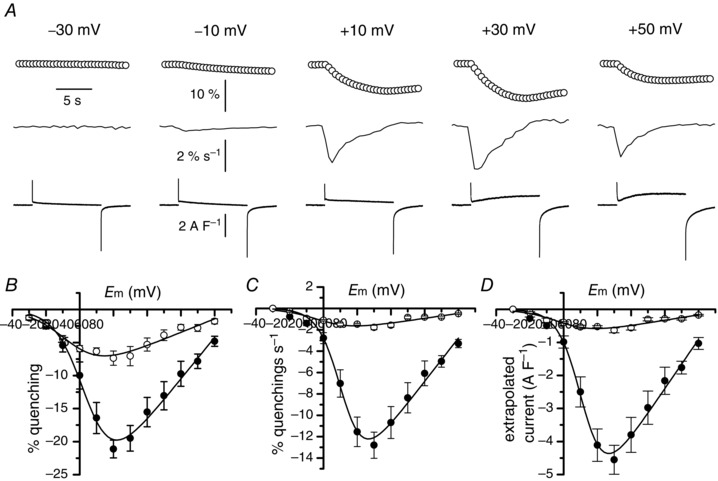
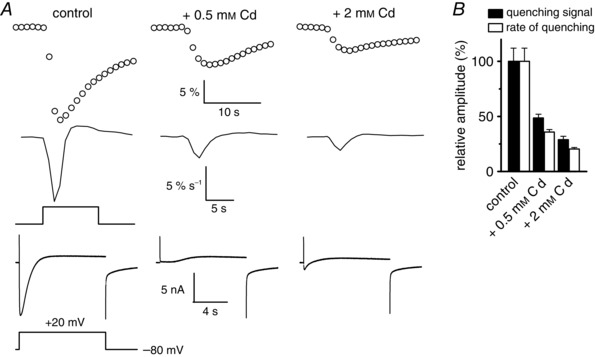
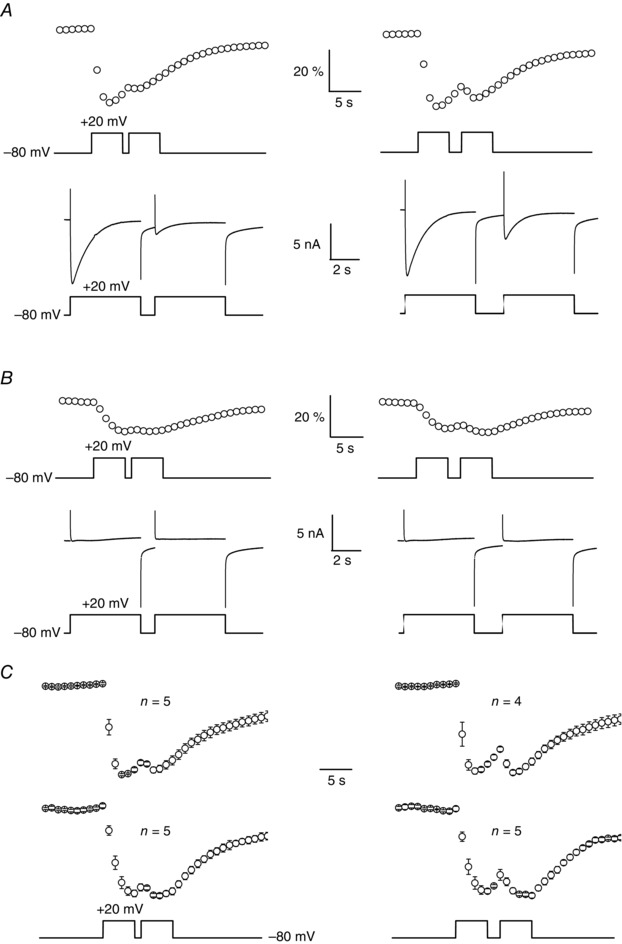
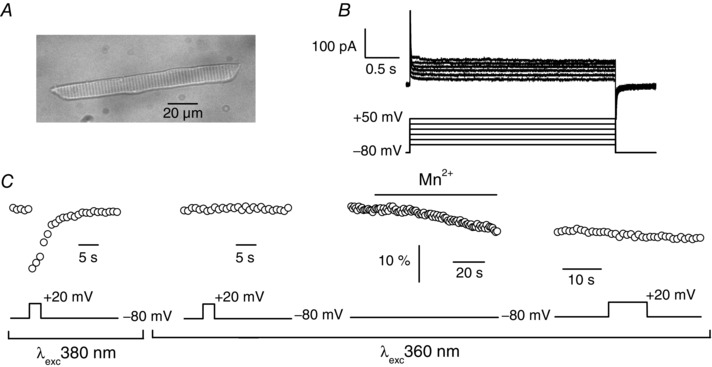
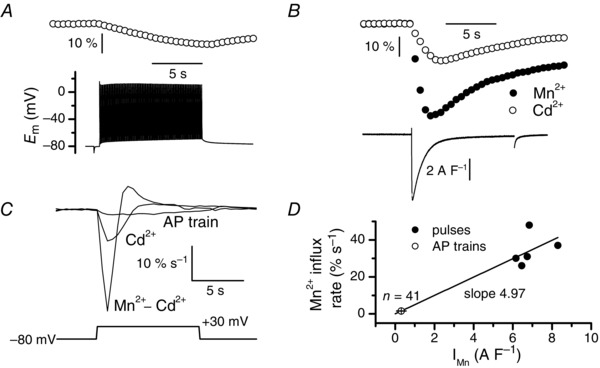
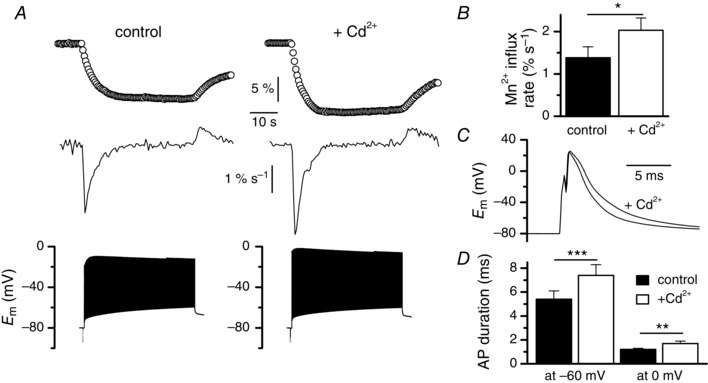
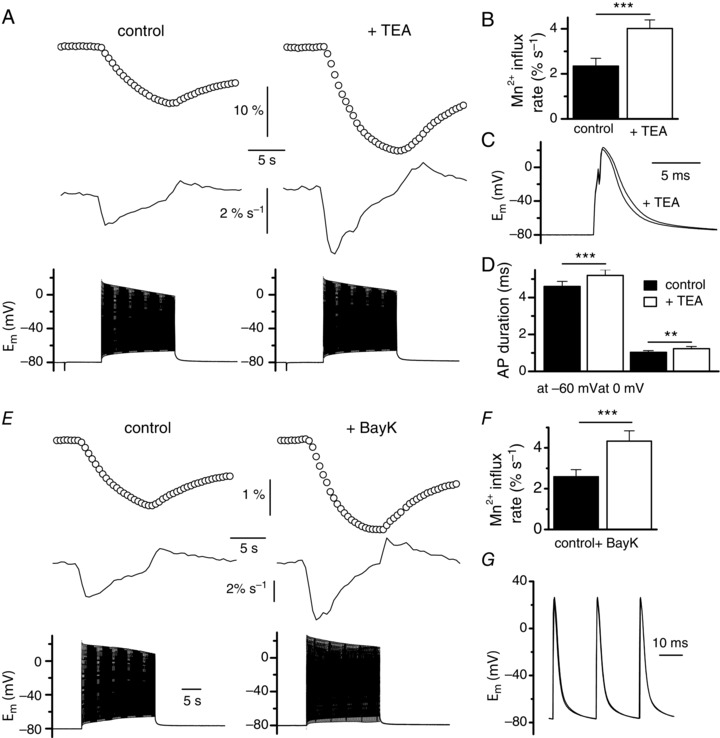
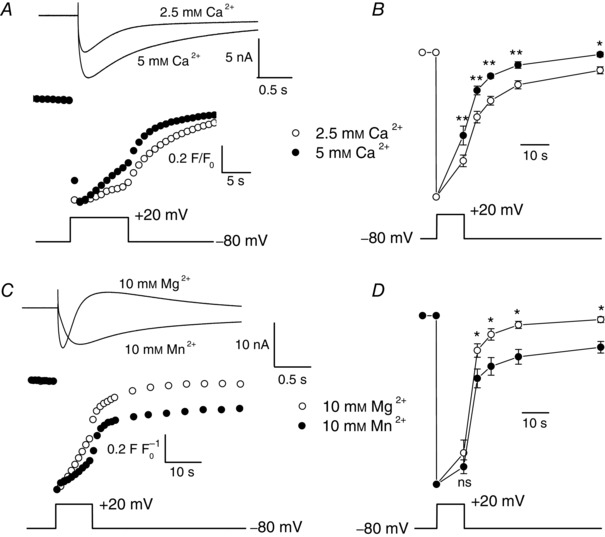
Muscle contraction is triggered by Ca(2+) ions released from the sarcoplasmic reticulum (SR) in response to depolarization of skeletal muscle fibres. Muscle activation is also associated with a voltage-activated trans-sarcolemmal Ca(2+) influx early identified as a current flowing through L-type Ca(2+) channels. Because removal of external Ca(2+) does not impede fibres from contracting, a negligible role was given to this voltage-activated Ca(2+) entry, although the decline of Ca(2+) release is more pronounced in the absence of Ca(2+) during long-lasting activation. Furthermore, it is not clearly established whether Ca(2+) exclusively flows through L-type channels or in addition through a parallel voltage-activated pathway distinct from L-type channels. Here, by monitoring the quenching of fura-2 fluorescence resulting from Mn(2+) influx in voltage-controlled mouse and zebrafish isolated muscle fibres, we show that the L-type current is the only contributor to Ca(2+) influx during long-lasting depolarizations in skeletal muscle. Calibration of the Mn(2+) quenching signal allowed us to estimate a mean Mn(2+) current of 0.31 ± 0.06 A F(-1) flowing through L-type channels during a train of action potentials. Measurements of SR Ca(2+) changes with fluo-5N in response to depolarization revealed that an elevated voltage-activated Ca(2+) current potentiated SR Ca(2+) loading and addition of external Mn(2+) produced quenching of fluo-5N in the SR, indicating that voltage-activated Ca(2+) /Mn(2+) influx contributes to SR Ca(2+) /Mn(2+) loading.


Figures

Figure 1
Figure 1. Voltage dependence of Mn2+ influx
A, simultaneous recordings of changes in fura‐2 fluorescence (upper traces) and membrane currents (lower traces) in the same fibre in response to depolarizing pulses of 10 s duration to the voltages indicated above the fluorescence traces. Middle traces correspond to derivatives of the fluorescence traces. Fluorescence images were captured at 2 Hz. B, superimposition of the traces of the current, the fura‐2 fluorescence change and its derivative on a fast time scale in response to the indicated voltage protocol. C, relationship between the mean changes in fura‐2 fluorescence and membrane potential (n = 8). D, relationships between the mean peak values of rate of changes in fura‐2 fluorescence (open symbols), corresponding to the derivative of the fluorescence signal, and membrane potential and between the mean Mn2+ current (closed symbols) and membrane potential (n = 7).
Figure 2
Figure 2. Conversion of the rate of change in fura‐2 fluorescence induced by Mn2+ influx into current density
A, superimposition of the changes in fura‐2 fluorescence induced by a 10 s voltage pulse given to +20 mV (lower trace in B) in the absence of Cd2+ (closed circles) and in the presence of Cd2+ (closed triangles) and of the difference between the two signals corresponding to the Cd2+‐sensitive component of the fluorescence changes (open circles) in the same fibre. Fluorescence images were captured at 1 Hz. B, rate of the Cd2+‐sensitive fluorescence change obtained in E. C, membrane currents obtained in the absence of Cd2+ (middle trace) and in the presence of Cd2+ (upper trace) and current difference corresponding to the Cd2+‐sensitive component of the current (lower trace) associated with the changes in fluorescence in A. D, relationship between the rate of the Cd2+‐sensitive fura‐2 fluorescence changes and the Cd2+‐sensitive component of Mn2+ current. Data points were fitted using a linear regression with a slope of 2.8.
Figure 3
Figure 3. Voltage dependence of Mn2+ influx in the presence of Cd2+
A, simultaneous recordings of changes in fura‐2 fluorescence (upper traces) and membrane currents (lower traces) in the same fibre in response to depolarizing pulses of 10 s duration to the voltages indicated above the fluorescence traces. Middle traces correspond to derivatives of the fluorescence traces. Fluorescence images were captured at 2 Hz. B, relationships between the mean change in fura‐2 fluorescence and membrane potential in the absence (closed symbols) (n = 7) and in the presence of Cd2+ (open symbols) (n = 8). C, relationships between the mean rate of changes in fura‐2 fluorescence and membrane potential in the absence (closed symbols) and in the presence of Cd2+ (open symbols). D, relationships between the mean calculated Mn2+ current density and membrane potential in the absence (closed symbols) and in the presence of Cd2+ (open symbols).
Figure 4
Figure 4. Effect of increasing concentrations of Cd2+ on voltage‐activated Mn2+ influx
A, simultaneous recordings of Mn2+ quenching signal, quenching signal derivatives and membrane currents in the same fibre (from top to bottom) in response to a depolarizing pulse of 10 s duration to +20 mV in control (left panel), in the presence of 0.5 mm Cd2+ (middle panel) and in the presence of 2 mm Cd2+ (right panel). Fluorescence images were captured at 1 Hz. B, mean relative amplitudes of the voltage‐activated quenching signal and their rates in control, and in the presence of 0.5 and 2 mm Cd2+.
Figure 5
Figure 5. Recovery from inactivation of voltage‐activated Mn2+ influx in the absence and in the presence of external Cd2+
A, simultaneous recordings of changes in fura‐2 fluorescence and membrane currents in the same fibre in response to two successive depolarizing pulses of 5 s duration to +20 mV separated by a pulse interval to −80 mV of 1 s (left panel) and 2 s duration (right panel) in the presence of a control external solution. Fluorescence images were captured at 1 Hz. B, simultaneous recordings of changes in fura‐2 fluorescence and membrane currents in the same fibre as in A in response to two successive depolarizing pulses of 5 s duration to +20 mV separated by a pulse interval to −80 mV of 1 s (left panel) and 2 s duration (right panel) in the presence of an external solution containing 0.5 mm Cd2+. Fluorescence images were captured at a frequency of 1 Hz. C, mean and SEM normalized changes in fura‐2 fluorescence induced by two successive depolarizing pulses of 5 s duration to +20 mV separated by a pulse interval to −80 mV of 1 s (left panel) and 2 s duration (right panel) in the presence of a control external solution (upper traces) and in the presence of an external solution containing 0.5 mm Cd2+ (lower traces).
Figure 6
Figure 6. Absence of voltage‐activated Mn2+ influx in isolated fibres from zebrafish larvae
A, transmitted light image of an isolated muscle fibre from zebrafish larvae. B, membrane currents (upper traces) elicited by voltage pulses given to −50, −30, −10, +10, +30 and +50 mV (lower traces). C, changes in fura‐2 fluorescence induced by a 3 s voltage pulse given to +20 mV upon excitation of fura‐2 at 380 nm (first panel from left), and upon excitation of fura‐2 at 360 nm (second panel from left), then induced by replacement of external Ca2+ by 10 mm Mn2+ at −80 mV upon excitation of fura‐2 at 360 nm (third panel from left), and in response of a 10 s voltage pulse given to +20 mV upon excitation of fura‐2 at 360 nm in the continuous presence of 10 mm Mn2+ (fourth panel from left) in the same muscle fibre. Fluorescence images were captured at 1 Hz.
Figure 7
Figure 7. Mn2+ influx and calculated Mn2+ current density induced by trains of action potentials
A, train of action potentials (50 Hz, 0.5 ms suprathreshold current pulses) (lower trace) and associated fura‐2 fluorescence change (upper trace). B, fura‐2 fluorescence changes in the absence (closed symbols) and in the presence of Cd2+ (open symbols) and Cd2+‐sensitive current trace (lower trace) induced by a 10 s voltage pulse to +30 mV in the same fibre as in A. Fluorescence images were captured at 2 Hz. C, corresponding rates of fura‐2 fluorescence changes obtained in A in response to the train of action potentials and in B in response to the voltage pulse in the presence of Cd2+ and corresponding rate of the Cd2+‐sensitive change of fura‐2 fluorescence. D, relationships between the rate of the Cd2+‐sensitive fura‐2 fluorescence changes obtained in response to a voltage pulse to +30 mV (closed symbols) and the Cd2+‐sensitive component of Mn2+ current and between rates of fluorescence changes induced by trains of action potentials (open symbol) and current density. Data points were fitted using a linear regression with a slope of 4.97.
Figure 8
Figure 8. Effect of Cd2+ on Mn2+ influx induced by trains of action potentials
A, fura‐2 fluorescence changes (upper traces) and corresponding rates of fura‐2 fluorescence changes (middle traces) in response to trains of action potentials (lower traces) in the absence and in the presence of Cd2+, in the same fibre. Fluorescence images were captured at 2 Hz. B, mean rates of fura‐2 fluorescence changes induced by trains of action potentials in the absence and in the presence of Cd2+ (n = 6). C, superimposition of the first action potential of the train recorded in the absence and in the presence of Cd2+ in the same fibre. D, mean durations of the action potentials between the maximal depolarization value and return to −60 mV and between the maximal depolarization and return to 0 mV in the absence and in the presence of Cd2+ (n = 6). Data were compared using a paired test.
Figure 9
Figure 9. Effect of TEA and of the Ca2+ channel agonist BayK 8644 on Mn2+ influx induced by trains of action potentials
A, fura‐2 fluorescence changes (upper traces) and corresponding rates of fura‐2 fluorescence changes (middle traces) in response to trains of action potentials of 10 s duration (lower traces) in the absence and in the presence of 10 mm TEA, in the same fibre. Fluorescence images were captured at 2 Hz. B, mean rates of fura‐2 fluorescence changes induced by trains of action potentials in the absence and in the presence of TEA (n = 8). C, superimposition of the first action potential of a train recorded in the absence and in the presence of TEA in the same fibre. D, mean durations of the action potentials between the maximal depolarization value and return to −60 mV and between the maximal depolarization and return to 0 mV in the absence and in the presence of TEA (n = 8). E, fura‐2 fluorescence changes (upper traces) and corresponding rates of fura‐2 fluorescence changes (middle traces) in response to trains of action potentials of 10 s duration (lower traces) in the absence and in the presence of 5 μm Bay K in the same fibre. Fluorescence images were captured at 2 Hz. F, mean rates of fura‐2 fluorescence changes induced by trains of action potentials in the absence and in the presence of Bay K (n = 6). G, superimposition of the first action potentials of the trains recorded in the absence and in the presence of Bay K in E. Data were compared using a paired test.
Figure 10
Figure 10. Effect of an increase in external [Ca2+] and of replacement of Mg2+ by Mn2+ on voltage‐induced SR Ca2+ signals
A, simultaneous recordings of membrane currents (upper traces) and fluo‐5N fluorescence changes (middle traces) in response to a 10 s voltage pulse (lower trace) in the presence of 2.5 and 5 mm external Ca2+. Note the different time scales used for the current and the fluorescence traces. Fluorescence images were captured at 1 Hz. Before normalization, the absolute mean values of F/F 0 were 0.99 and 0.98 at basal level and 0.17 and 0.18 at peak in control and in the presence of 5 mm Ca2+, respectively. B, mean values of fluo‐5N fluorescence (upper traces) in response to a voltage pulse (lower trace), at the end of the depolarization and 5, 10, 20 and 50 s after the end of the depolarization in the presence of 2.5 and 5 mm external Ca2+ (n = 7). C, simultaneous recordings of membrane currents (upper traces) and fluo‐5N fluorescence changes (middle traces) in response to a 10 s voltage pulse (lower trace) in the presence of 10 mm Mg2+ and 10 mm Mn2+. Note the different time scales used for the current and the fluorescence traces. Fluorescence images were captured at 1 Hz and then at 0.2 Hz. Before normalization, the absolute mean values of F/F 0 were 1.00 and 0.95 at basal level and 0.28 and 0.30 at peak in control and in the presence of 10 mm Mn2+, respectively. D, mean values of fluo‐5N fluorescence (upper traces) in response to a voltage pulse (lower trace), at the end of the depolarization and 5, 10, 20 and 50 s after the end of the depolarization in the presence of 10 mm Mg2+ and 10 mm Mn2+ (n = 5) (ns, not significant).

Similar articles

Cited by

References

    1. Armstrong CM, Bezanilla FM & Horowicz P (1972). Twitches in the presence of ethylene glycol bis(‐aminoethyl ether)‐N,N′‐tetracetic acid. Biochim Biophys Acta 267, 605–608. - PubMed
    1. Bannister RA, Pessah IN & Beam KG (2009). The skeletal L‐type Ca2+ current is a major contributor to excitation‐coupled Ca2+ entry. J Gen Physiol 133, 79–91. - PMC - PubMed
    1. Berbey C & Allard B (2009). Electrically silent divalent cation entries in resting and active voltage‐controlled muscle fibers. Biophys J 96, 2648–2657. - PMC - PubMed
    1. Brum G, Rios E & Stefani E (1988). Effects of extracellular calcium on calcium movements of excitation–contraction coupling in frog skeletal muscle fibres. J Physiol 398, 441–473. - PMC - PubMed
    1. Byerly L, Chase PB & Stimers JR (1984). Calcium current activation kinetics in neurones of the snail Lymnaea stagnalis. J Physiol 348, 187–207. - PMC - PubMed

Publication types