. 2016 Mar;23(3):454-68.
doi: 10.1038/cdd.2015.113. Epub 2015 Sep 18.

Rint1 inactivation triggers genomic instability, ER stress and autophagy inhibition in the brain

Affiliations

Rint1 inactivation triggers genomic instability, ER stress and autophagy inhibition in the brain

P Grigaravicius et al. Cell Death Differ. 2016 Mar.

Abstract

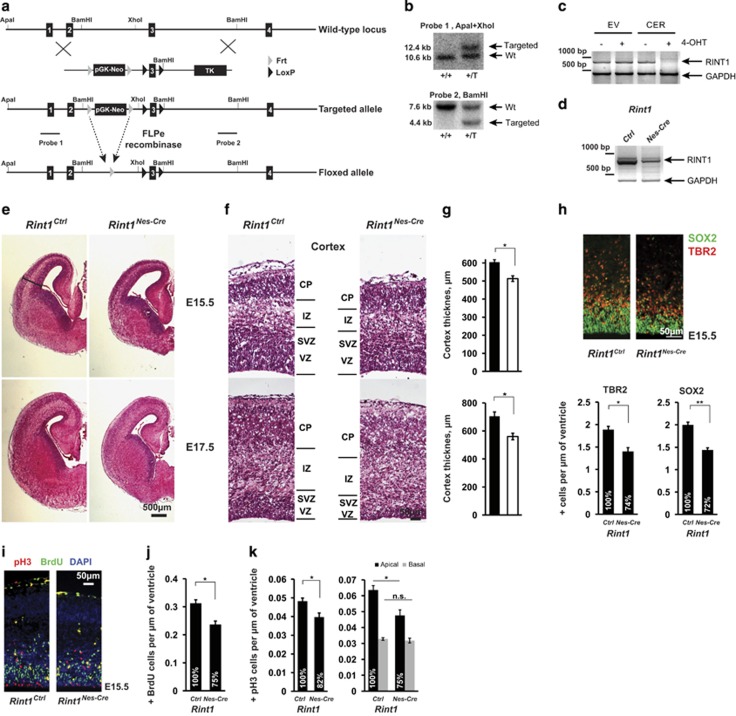
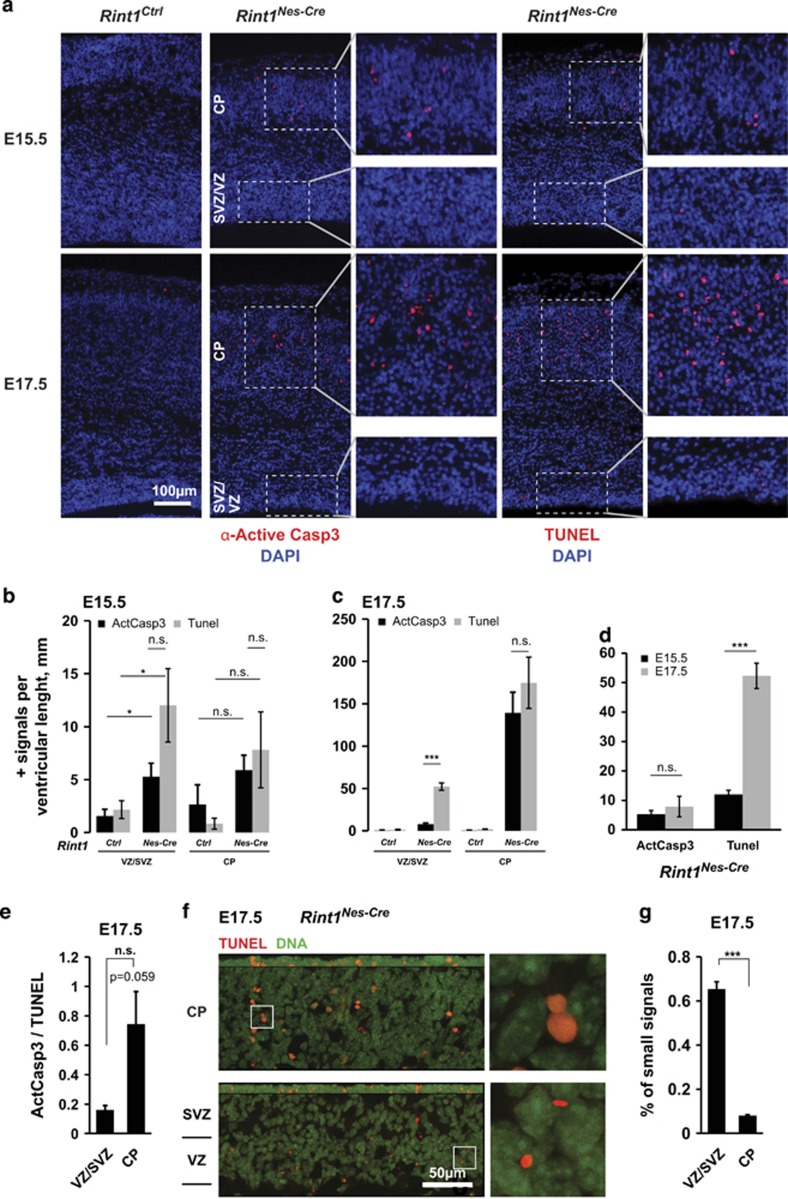
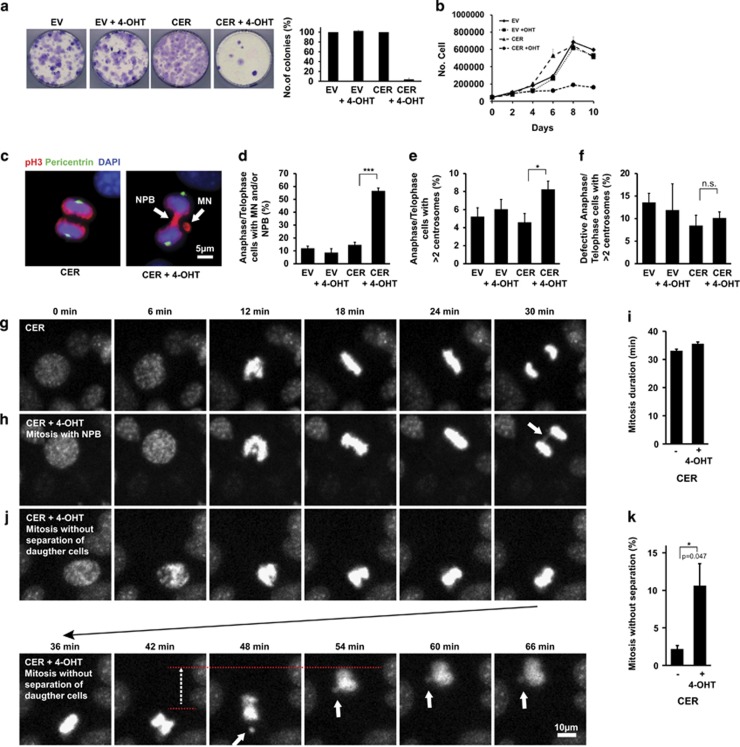
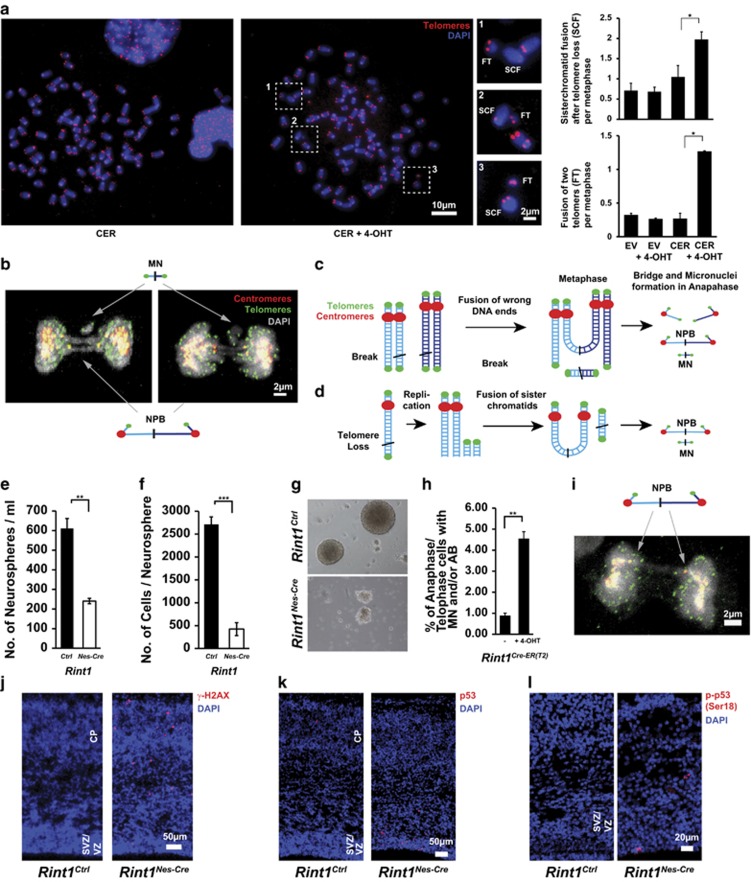
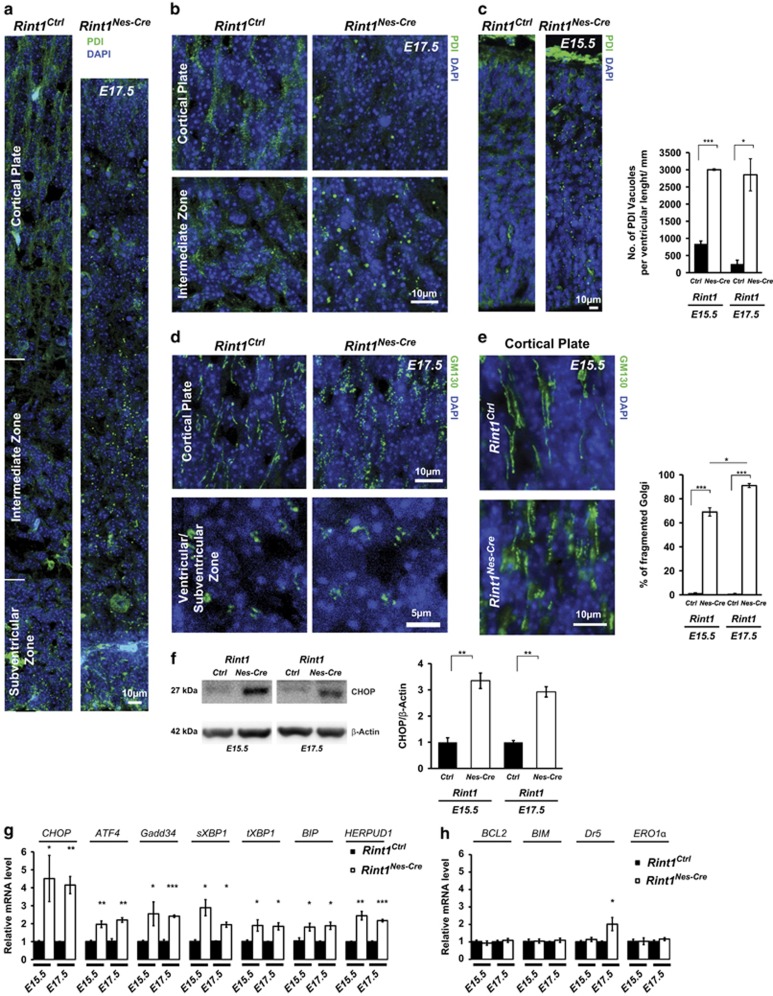
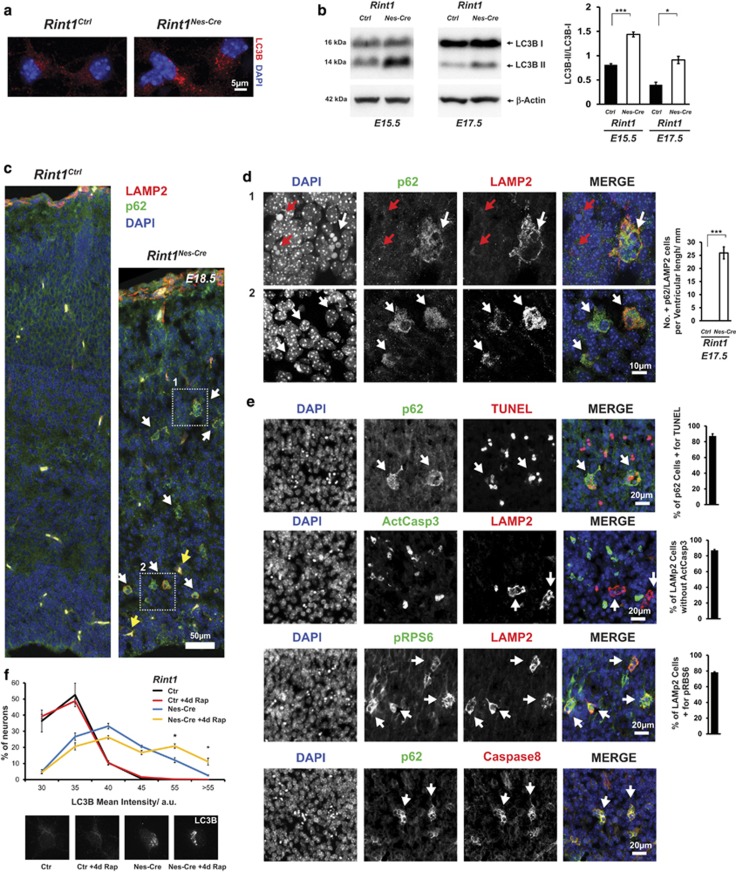
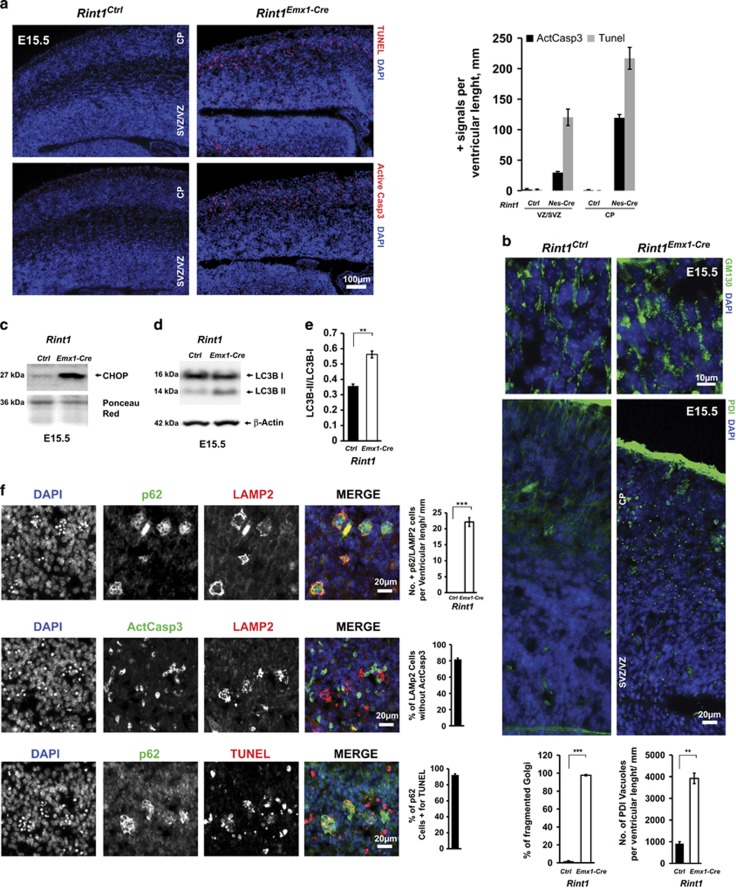
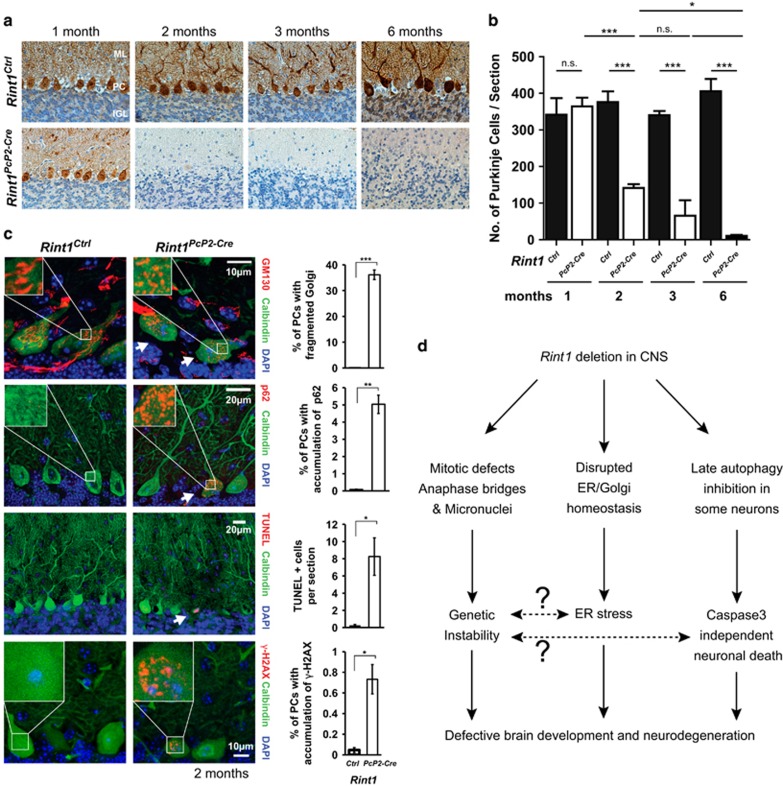
Endoplasmic reticulum (ER) stress, defective autophagy and genomic instability in the central nervous system are often associated with severe developmental defects and neurodegeneration. Here, we reveal the role played by Rint1 in these different biological pathways to ensure normal development of the central nervous system and to prevent neurodegeneration. We found that inactivation of Rint1 in neuroprogenitors led to death at birth. Depletion of Rint1 caused genomic instability due to chromosome fusion in dividing cells. Furthermore, Rint1 deletion in developing brain promotes the disruption of ER and Cis/Trans Golgi homeostasis in neurons, followed by ER-stress increase. Interestingly, Rint1 deficiency was also associated with the inhibition of the autophagosome clearance. Altogether, our findings highlight the crucial roles of Rint1 in vivo in genomic stability maintenance, as well as in prevention of ER stress and autophagy.


Figures

Figure 1
Figure 1
Rint1 deletion in the brain leads to developmental defects in cortex. (a) Targeting strategy for conditional inactivation of Rint1. Floxed allele has loxP sites flanking exon 3 that can be recombined by the Cre protein leading to exon 3 deletion and thus to the out of frame mutant. (b) Southern blot analysis with two different probes indicates ES clones with correctly integrated targeting vector. (c) mRNA expression analysis shows loss of Rint1 mRNA in immortalized MEFs after the 4-OHT mediated Rint1 inactivation. (d) mRNA analysis of cortices from E15.5 Rint1Nes-Cre and Rint1Ctrl embryos with indicated genotypes. (e) Comparison of Rint1Ctrl and Rint1Nes-Cre brains at E15.5 and E17.5 by H&E staining of coronal sections. (f) Defects in Rint1Nes-Cre cortex indicating reduction of ventricular (VZ) and sub-ventricular (SVZ) zones at E15.5 and E17.5. IZ, intermediate zone; CP, cortical plate. The quantification of cortex thickness is shown in (g). (h) Neuronal progenitors labeled by Sox2 and TBR2 are significantly reduced in Rint1Nes-Cre cortex at E15.5. Lower panel shows corresponding quantifications. (i) Comparison of mitotic pH3+ and proliferating cells (BrdU+ cells) in wild-type and Rint1Nes-Cre cortex from E15.5 embryos. Quantification for BrdU+ in (j) and for pH3+ in (k) shows significant reduction of both cell types in cortex (n=4). (g–j) Quantifications show average values with the standard error measured in four embryos. Stars indicate significance in two-tailed Student's t-test *P<0.05, **P<0.005, ***P<0.0005
Figure 2
Figure 2
Rint1 deficiency promotes apoptosis in the cortex. (a) Detection of apoptotic cells by labeling active Caspase3 (ActCasp3) (left panel—red cells) and fragmented DNA by TUNEL staining (right panel—red cells) after Rint1 inactivation in the brain at indicated embryonic stages. Inserts show magnification of VZ/SVZ and CP layers. (b) Increase in ActCasp3 (black columns) and TUNEL (gray columns) signals in cortical progenitors (VZ/SVZ) and neurons (CP) of Rint1Nes-Cre embryos at E15.5 is drastically enhanced at later stages E17.5 (c) with an exception for ActCasp3 signals in VZ/SVZ (d). Indeed the ratio between ActCasp3 and TUNEL signals at E17.5 (e) shows that cortical progenitors are much less affected by Caspase3-mediated apoptosis than the neurons in CP. (f) Confocal microscopy depicts differences in morphology of TUNEL-positive signals (Red) in different cortical layers. Magnified images on the right panel are taken from the areas indicated by white frames. (g) Majority of TUNEL signals in cortical progenitors are much smaller than in differentiated neurons. Stars indicate significance in two tailed Student's t-test *P<0.05, ***P<0.0005
Figure 3
Figure 3
Mitotic defects after Rint1 deletion in MEFs. (a) Colony formation assay after 4-OHT mediated Rint1 deletion in immortalized MEFs as well as cell counting (b) every 2 days demonstrate growth defects. (c) Two days after 4-OHT treatment MEFs were fixed and co-stained against phospho-Histone-3 (pH3) and Pericentrin. Arrows indicate formation of Nucleo-Plasmic Bridges (NBP) and Micronuclei (MN) independent of centrosome amplification in anaphases when Rint1 is deleted. (d) Percentage of Anaphase/Telophase cells with mitotic defects, (e) percentage of mitotic cells with amplified centrosomes and (f) percentage of the defective mitosis that have amplified centrosomes. (g, h and j) Live-cell imaging of immortalized MEFs mitosis. Nuclei of living cells were labeled with Hoechst33342 dye and imaged every 6 min. (g) Time course of wild-type cell mitosis compared with the mitosis of Rint1-deficient cells (h) arrow indicate NPB. (j) An example where Rint1-deficient daughter cells cannot separate due to anaphase bridges, performing tension-based movement indicated by red dashed lines and the dashed arrow. White arrow indicates Micronuclei formation. Duration of mitosis in MEFs does not change after Rint1 deletion (i), quantification was performed excluding mitosis without separation. Percentage of inhibited daughter cell separation is significantly increased in Rint1-deficient cells (k). Stars indicate significance in two tailed Student's t-test *P<0.05, ***P<0.0005
Figure 4
Figure 4
Genetic instability induced by Rint1 deficiency. (a) Metaphase spreads show increased genomic instability after Rint1 inactivation in MEFs. Magnified regions show chromosomes without two telomeres (sister chromatid fusion, SCF) and nearby small DNA fragments with two telomeres (fused telomeres, FT). Evaluations in the right panel show a significant increase in these chromosomal aberrations after Rint1 inactivation. (b) Projection of confocal images of the defective mitosis with co-stained telomeres (green) and centromeres (red) demonstrating DNA bridges between two centromeres of daughter cells and micronuclei with two telomeres. (c) Mechanism of bridge and micronuclei formation in case of fusion of wrong DNA ends of DSBs in close proximity. (d) Mechanism of bridge and micronuclei formation in case of telomere loss. After replication the telomere-less chromatids are fused forming SCF and FT. Rint1Nes-Cre brains (n=5) have a reduced pool of neural stem cells (e) with altered capacity to proliferate in comparison with Rint1Ctrl mice (n=17) (f). (g) Representative images of neurospheres isolated from Rint1Ctrl and Rint1Nes-Cre mice brains. (h) A significant increase in mitotic defects in primary neuronal stem cells from Rint1Cre-ER(T2) mice 2 days after 4-OHT treatment. (i) Projection of confocal images of the defective mitosis in neuronal progenitor cell 2 days after 4-OHT treatment, co-stained against telomeres (green) and centromeres (red) showing the same bridge geometry as in MEFs. Stars indicate significance in two tailed Student's t-test *P<0.05, **P<0.005, ***P<0.0005
Figure 5
Figure 5
Rint1 deficiency destabilizes ER, Cis/Trans-Golgi homeostasis and cause ER stress in CNS. (a and b) Dot-like structure of ER indicates its vacuolization in Rint1Nes-Cre cortex at E17.5 visualized by immunofluorescent staining of ER luminal protein PDI. (c) ER vacuolization already at E15.5. (d) GM130 staining in indicated E17.5 cortex regions shows Cis-Golgi dispersion in CP as well as in VZ and SVZ of Rint1Nes-Cre cortex starting already at E15.5 (e). (f) Western blot analysis shows CHOP induction in Rint1Nes-Cre cortex at indicated developmental stages, indicating ER stress. (g) Relative mRNA expression of UPR genes in Rint1Nes-Cre vs Rint1Ctrl cortices quantified by qPCR analysis. (h) Relative mRNA expression of genes downstream of CHOP in Rint1Nes-Cre vs Rint1Ctrl cortices quantified by qPCR analysis. Stars indicate significance in two tailed or one tailed (g, h) Student's t-test *P<0.05, **P<0.005, ***P<0.0005
Figure 6
Figure 6
Defective autophagy after Rint1 inactivation. (a) Accumulation of autophagosomes labeled by LC3B in cortical neurons. (b) Western blot analysis of protein extracts from cortex shows increased conversion from LC3B-I to LC3B-II. Right panel shows quantification of LC3B-II/LC3B-I ratio from three different embryos. (c) Confocal microscopy of p62- (green) and LAMP2- (red) positive neurons marked by white arrows in Rint1Nes-Cre cortex from E18.5. Yellow arrows indicate blood cells. Magnified images from frames 1 and 2 in (c) are depicted in (d). All p62- and LAMP2-positive cells in CP are with pyknotic nuclei (white arrow) representing dying cells (d1), however, not all cells with pyknotic nuclei show accumulation of p62 and LAMP2 (red arrows). In lower panel, confocal microscopy shows that in SVZ p62/LAMP2-positive neurons does not exhibit pyknotic nuclei (white arrows). Right panel shows quantification of p62- and LAMP2-positive cells in Rint1Nes-Cre cortices. p62- and LAMP2-positive cells (white arrows) co-localize with TUNEL, p-RPS6, Caspase8 but not with active Caspase3 (e) at E17.5. Right panel shows percentage for co-localization of indicated signals. (f) Percentage of neurons with given mean intensity of LC3B signals from Rint1Ctrl and Rint1Nes-Cre cortices after 4 days treatment with 100 nM rapamycin. Stars indicate significance in two tailed Student's t-test *P<0.05, ***P<0.0005
Figure 7
Figure 7
Deletion of Rint1 in progenitors of dorsal telencephalon cause severe defects already at E15.5. (a) TUNEL and Activated Caspase 3 staining of Rint1Ctrl and Rint1Emx1Cre cortex at 15.5 exhibits extensive apoptosis not only in CP but also in VZ/SVZ as shown in the quantification in the right panel. (b) Destabilization of Golgi (GM130) and ER (PDI) homeostasis in Rint1Emx1Cre cortices with quantification of Golgi fragmentation and ER vacuolization in the bottom panel. Levels of ER stress marker CHOP (c) as well as autophagosome marker LC3B-II (d) are increased in Rint1Emx1Cre cortex. (e) Quantification of LC3B-II/LC3B-I and LC3B-II/Actin ratios in cortex from three different embryos. (f) p62 and LAMP2 accumulation in apoptotic active Caspase3-negative cells in Rint1Emx1Cre cortex at E15.5 with statistic evaluation in the right panel. Stars indicate significance in two tailed Student's t-test **P<0.005, ***P<0.0005
Figure 8
Figure 8
Neurodegeneration triggered by Rint1 inactivation in Purkinje cells. (a) Calbindin D-28K (brown) staining of Purkinje cells on paraffin sections of cerebellum. (b) Quantification of Purkinje cell numbers per section in postnatal animals. (c) Fragmentation of Golgi (GM130), accumulation of p62, γ-H2AX and TUNEL signals in Purkinje cells induced by Rint1 inactivation, visualized by confocal (GM130, p62, γ-H2AX) and wide field (TUNEL) microscopy, with the quantification in the right panel. (d) Scheme of Rint1 role in CNS. Stars indicate significance in two tailed Student's t-test *P<0.05, **P<0.005, ***P<0.0005

Similar articles

Cited by

References

    1. Atkin JD, Farg MA, Soo KY, Walker AK, Halloran M, Turner BJ et al. Mutant SOD1 inhibits ER-Golgi transport in amyotrophic lateral sclerosis. J Neurochem 2014; 129: 190–204. - PubMed
    1. Jellinger KA. Basic mechanisms of neurodegeneration: a critical update. J Cell Mol Med 2010; 14: 457–487. - PMC - PubMed
    1. Boland B, Kumar A, Lee S, Platt FM, Wegiel J, Yu WH et al. Autophagy induction and autophagosome clearance in neurons: relationship to autophagic pathology in Alzheimer's disease. J Neurosci 2008; 28: 6926–6937. - PMC - PubMed
    1. Wong E, Cuervo AM. Autophagy gone awry in neurodegenerative diseases. Nat Neurosci 2010; 13: 805–811. - PMC - PubMed
    1. Noda T, Fujita N, Yoshimori T. The late stages of autophagy: how does the end begin? Cell Death Differ 2009; 16: 984–990. - PubMed

Publication types

Substances