. 2016 Jan;65(1):188-200.
doi: 10.2337/db15-0647. Epub 2015 Sep 17.

Obesity Impairs Skeletal Muscle Regeneration Through Inhibition of AMPK

Affiliations

Obesity Impairs Skeletal Muscle Regeneration Through Inhibition of AMPK

Xing Fu et al. Diabetes. 2016 Jan.

Abstract

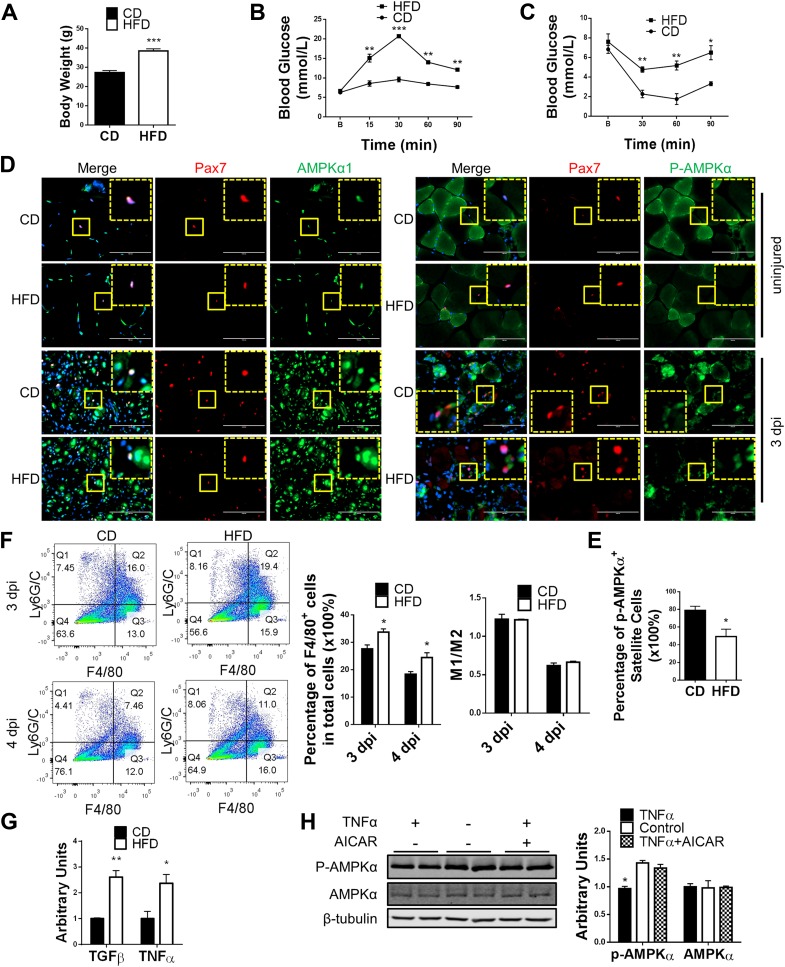
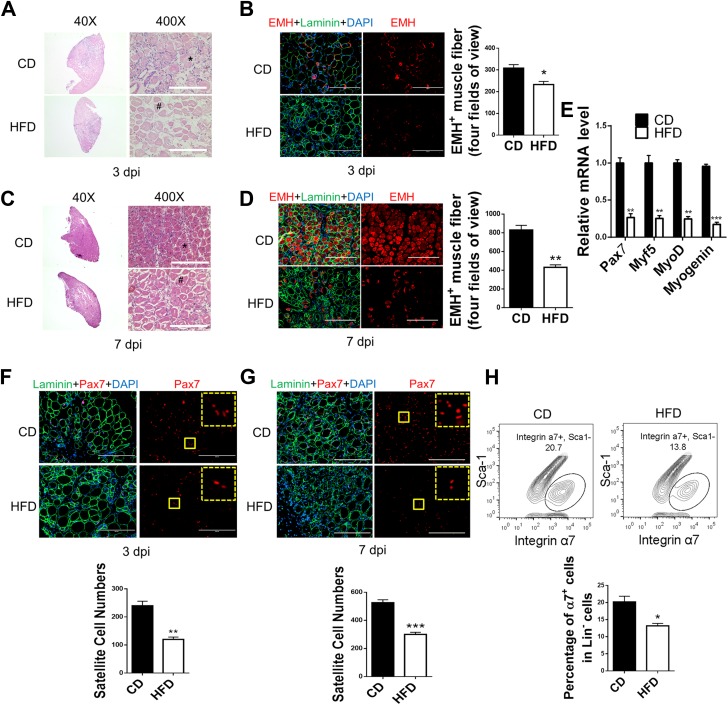
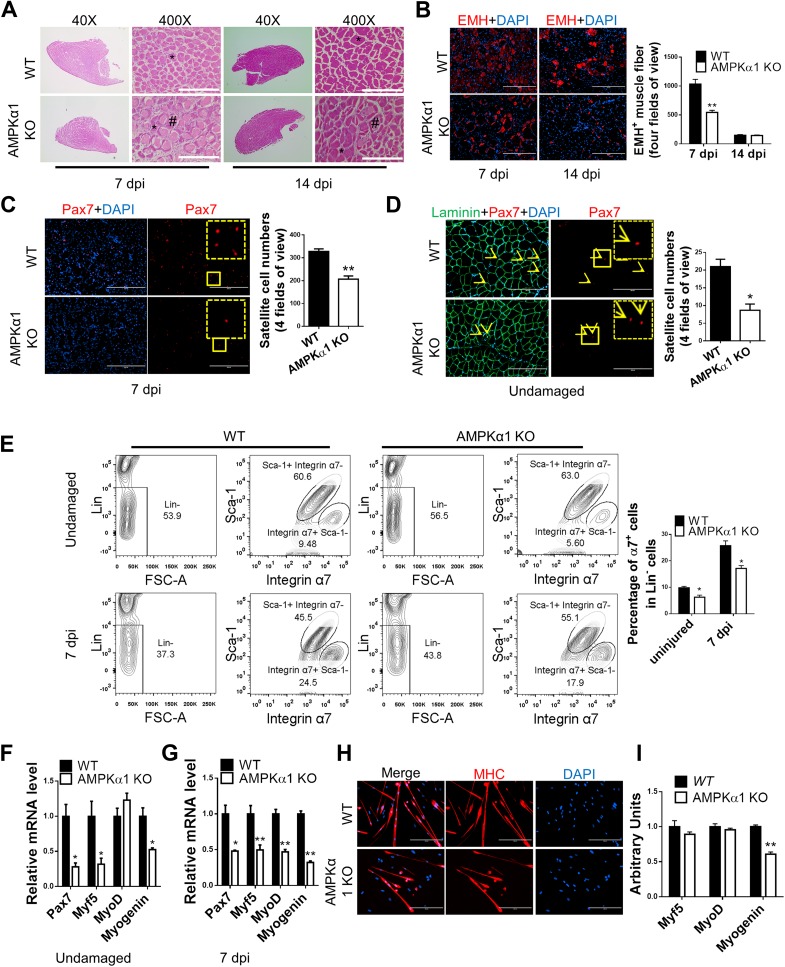
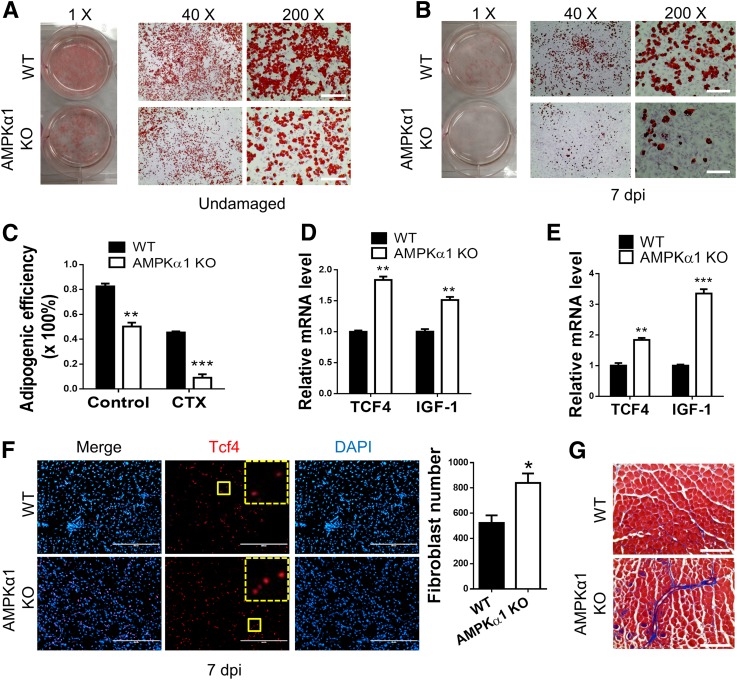
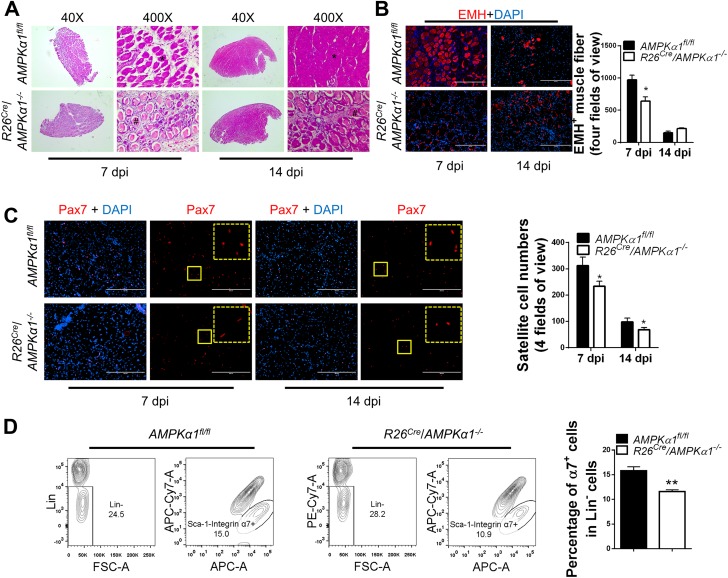
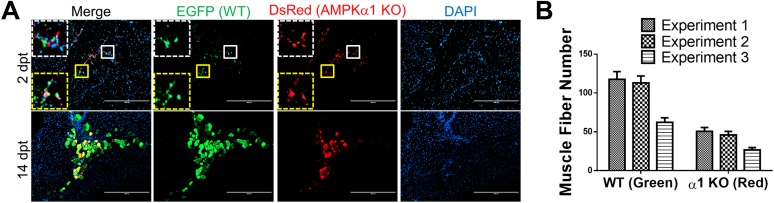
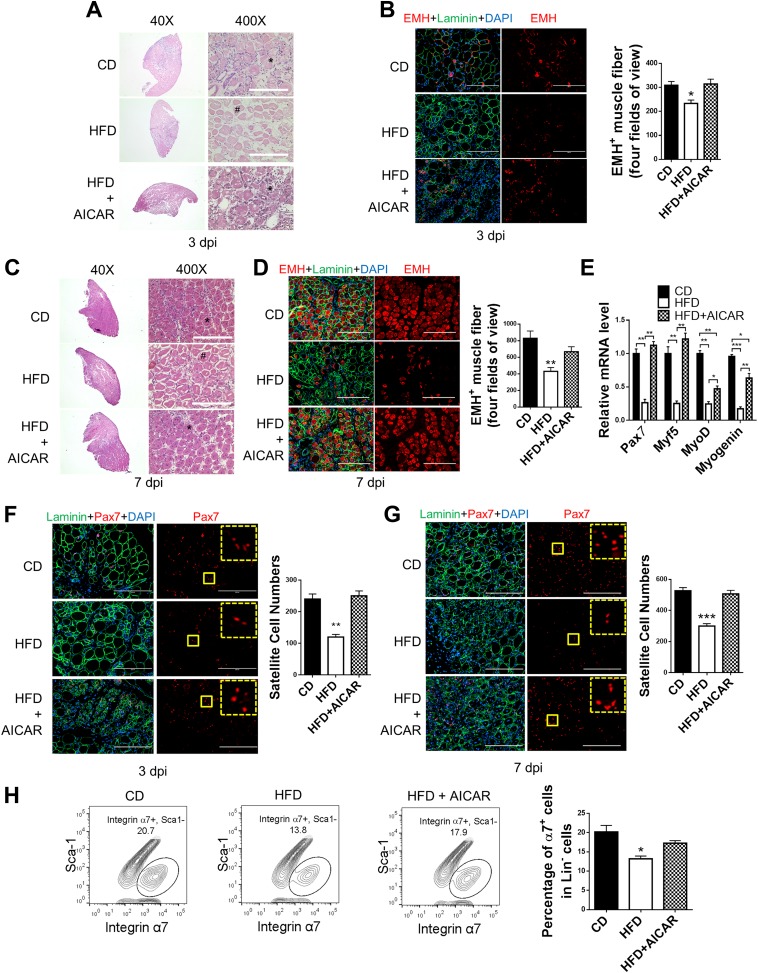
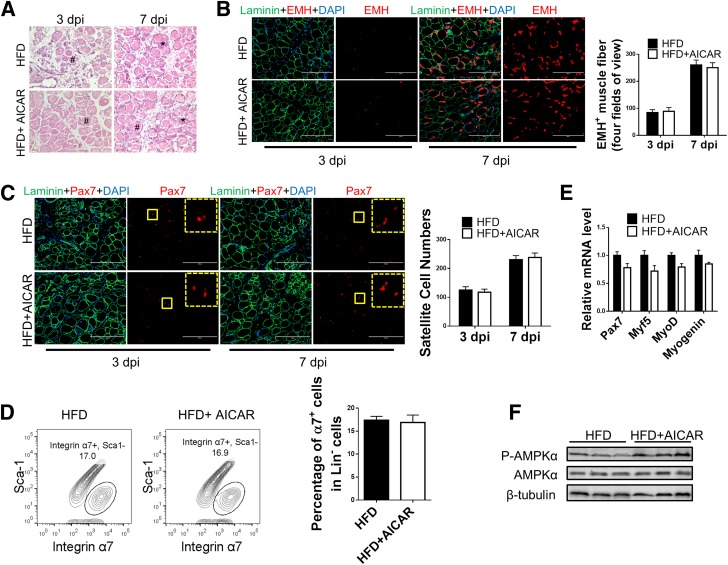
Obesity is increasing rapidly worldwide and is accompanied by many complications, including impaired muscle regeneration. The obese condition is known to inhibit AMPK activity in multiple tissues. We hypothesized that the loss of AMPK activity is a major reason for hampered muscle regeneration in obese subjects. We found that obesity inhibits AMPK activity in regenerating muscle, which was associated with impeded satellite cell activation and impaired muscle regeneration. To test the mediatory role of AMPKα1, we knocked out AMPKα1 and found that both proliferation and differentiation of satellite cells are reduced after injury and that muscle regeneration is severely impeded, reminiscent of hampered muscle regeneration seen in obese subjects. Transplanted satellite cells with AMPKα1 deficiency had severely impaired myogenic capacity in regenerating muscle fibers. We also found that attenuated muscle regeneration in obese mice is rescued by AICAR, a drug that specifically activates AMPK, but AICAR treatment failed to improve muscle regeneration in obese mice with satellite cell-specific AMPKα1 knockout, demonstrating the importance of AMPKα1 in satellite cell activation and muscle regeneration. In summary, AMPKα1 is a key mediator linking obesity and impaired muscle regeneration, providing a convenient drug target to facilitate muscle regeneration in obese populations.


Figures

Figure 1
Figure 1
Reduced AMPK activity in satellite cells of obese mice during muscle regeneration. A: Body weight of male mice fed a control diet (CD) and a high-fat diet (HFD). B: Glucose tolerance test of CD and HFD mice. C: Insulin tolerance test of CD and HFD mice. D: IHC staining identifying AMPKα1 expression and p-AMPKα level in satellite cells of muscle before injury and 3 days postinjury (dpi). The dotted-line inset on each image shows magnification of the area marked by the solid-line box. Scale bars = 100 μm. E: Quantification of satellite cells staining positive for p-AMPKα in muscle of CD and HFD mice 3 dpi. F: FACS identifying M1 (Q2) and M2 (Q3) macrophages in regenerating muscle of CD and HFD mice. G: RT-PCR of TGFβ and TNFα expression in muscle of CD and HFD mice at 3 dpi. H: Western blot analysis of p-AMPKα and AMPKα levels in WT satellite cells treated with 10 ng/mL TNFα with and without 125 μmol/L AICAR for 12 h and untreated control. Data are mean ± SEM (n = 3). *P < 0.05, **P < 0.01, ***P < 0.0001 vs. control.
Figure 2
Figure 2
Attenuated muscle regeneration in mice with diet-induced obesity. TA muscle of mice fed a control diet (CD) and a high-fat diet (HFD) were injured by CTX injection. A: Regeneration of TA muscle at 3 days postinjury (dpi) examined by H-E staining showing necrotic muscle fibers (#) and regenerating muscle fibers (*). B: IHC staining of EMH+ muscle fibers in TA muscle at 3 dpi and quantification. C: Regeneration of TA muscle at 7 dpi examined by H-E staining showing necrotic muscle fibers (#) and regenerating muscle fibers (*). D: IHC staining of EMH+ muscle fibers in TA muscle at 7 dpi and quantification. E: Pax7, Myf5, MyoD, and myogenin mRNA levels in TA muscle at 3 dpi. F and G: IHC staining of Pax7+ satellite cells in TA muscle at 3 dpi (F) and 7 dpi (G) and quantification. The dotted-line inset on each image shows magnification of the area marked by the solid-line box. H: FACS for Lin/Sca-1/integrin α7+ satellite cells in TA muscle at 7 dpi. Data are mean ± SEM (n = 3). Scale bars = 200 μm. *P < 0.05, **P < 0.01, ***P < 0.0001 vs. control.
Figure 3
Figure 3
Impaired muscle regeneration efficiency in AMPKα1 KO mice. TA muscle of WT and AMPKα1 KO mice was injured by CTX injection. A: Regeneration of TA muscle at 7 and 14 days postinjury (dpi) examined by H-E staining showing necrotic muscle fibers (#) and regenerating muscle fibers (*). B: EMH+ muscle fibers in TA muscle at 7 and 14 dpi detected by IHC staining and quantification of EMH+ muscle fibers. C and D: IHC staining for Pax7+ satellite cells (arrowheads) in TA muscle at 7 dpi (C) and before injury (D). The dotted-line inset on each image shows magnification of the area marked by the solid-line box. E: FACS for Lin/Sca-1/integrin α7+ satellite cells in TA muscle before injury and at 7 dpi. F and G: Pax7, Myf5, MyoD, and myogenin mRNA levels before injury (F), and 7 dpi (G). H: Myogenic differentiation of Lin/Sca-1/integrin α7+ cells isolated from undamaged muscle measured by immunocytochemical staining for myosin heavy chain (MHC). I: Myf5, MyoD, and myogenin mRNA levels in WT satellite cells and AMPKα1 KO satellite cells 1 day after induction of myogenic differentiation. Data are mean ± SEM (n = 3). Scale bars = 200 μm. *P < 0.05, **P < 0.01 vs. control.
Figure 4
Figure 4
Enhanced fibrogenesis by AMPKα1 KO in muscle during regeneration. A and B: Adipogenic differentiation of Lin/Sca-1+ cells isolated from undamaged WT and AMPKα1 KO muscle (A) and from WT and AMPKα1 KO muscle at 7 days postinjury (dpi) (B) as measured by oil red O staining. C: Quantified adipogenic efficiencies of Lin/Sca-1+ cells shown in A and B expressed as percentage of oil red O–positive cells. D: TCF4 and IGF-I mRNA levels in WT and AMPKα1 KO nonmyogenic cells isolated from muscle at 7 dpi. E: TCF4 and IGF-I mRNA levels in WT and AMPKα1 KO muscle at 7 dpi. F: IHC staining of Tcf4+ fibroblasts in WT and AMPKα1 KO regenerating muscle at 7 dpi. The dotted-line inset on each image shows magnification of the area marked by the solid-line box. G: Trichrome staining of WT and AMPKα1 KO TA sections at 14 dpi. Data are mean ± SEM (n = 3). Scale bars = 200 μm. *P < 0.05, **P < 0.01, ***P < 0.0001 vs. control.
Figure 5
Figure 5
Impaired muscle regeneration efficiency in conditional AMPKα1 KO mice. TA muscle of tamoxifen-treated AMPKα1fl/fl mice and conditional AMPKα1 KO (R26Cre/AMPKα1−/−) mice were injured by CTX injection. A: Regeneration of TA muscle at 7 and 14 days postinjury (dpi) examined by H-E staining showing necrotic muscle fibers (#) and regenerating muscle fibers (*). B: EMH+ muscle fibers in TA muscle at 7 and 14 dpi detected by IHC staining and quantification of EMH+ muscle fibers. C: IHC staining for Pax7+ satellite cells in TA muscle at 7 and 14 dpi. The dotted-line inset on each image shows magnification of the area marked by the solid-line box. D: FACS for Lin/Sca-1/integrin α7+ satellite cells in TA muscle 7 days after CTX injection. Data are mean ± SEM (n = 3). Scale bars = 200 μm. *P < 0.05, **P < 0.01 vs. control.
Figure 6
Figure 6
Reduced myogenesis in transplanted satellite cells with AMPKα1 KO during muscle regeneration. A: One day after CTX injection at TA muscle, 3 × 10⁴ AMPKα1+/+/EGFP satellite cells and 3 × 10⁴ R26Cre/AMPKα1fl/fl/DsRed satellite cells were transplanted into each TA muscle of WT recipient mice. The recipient mice were treated with tamoxifen for 3 days from the day of transplantation. TA muscle was isolated at 2 days (top row) and 14 days (bottom row) after satellite cell transplantation and immunostained to identify muscle fibers derived from transplanted satellite cells. The dotted-line insets on each image show magnification of the corresponding areas marked by the solid-line boxes. Scale bars = 200 μm. B: Numbers of muscle fibers formed by transplanted myoblasts at 14 days after satellite cell transplantation in three independent experiments. Data are mean ± SEM (n = 3). dpt, days posttransplantation.
Figure 7
Figure 7
Attenuated AMPK activity and muscle regeneration in diet-induced obesity is rescued by AICAR treatment. TA muscle of mice fed a control diet (CD), obese mice fed a high-fat diet (HFD), and obese mice treated with AICAR (HFD + AICAR) were injured by CTX injection. Muscle was collected 1 h after the last AICAR treatment. A: Regeneration of TA muscle at 3 days postinjury (dpi) examined by H-E staining showing necrotic muscle fibers (#) and regenerating muscle fibers (*). B: IHC staining of EMH+ muscle fibers in TA muscle at 3 dpi and quantification. C: Regeneration of TA muscle at 7 dpi examined by H-E staining showing necrotic muscle fibers (#) and regenerating muscle fibers (*). D: IHC staining of EMH+ muscle fibers in TA muscle at 7 dpi and quantification. E: Pax7, Myf5, MyoD, and myogenin mRNA levels in TA muscle at 3 dpi. F and G: IHC staining of Pax7+ satellite cells in TA muscle at 3 dpi (F) and 7 dpi (G) and quantification. The dotted-line inset on each image shows magnification of the area marked by the solid-line box. H: FACS for Lin/Sca-1/integrin α7+ satellite cells in TA muscle at 7 dpi. Data are mean ± SEM (n = 3). Scale bars = 200 μm. *P < 0.05, **P < 0.01, ***P < 0.0001 vs. control.
Figure 8
Figure 8
AMPKα1 deficiency in satellite cells abolishes the promotion effect of AICAR on muscle regeneration of obese mice. Pax7Cre/AMPKα1fl/fl were fed a high-fat diet (HFD). Satellite cell–specific AMPKα1 KO in Pax7Cre/AMPKα1fl/fl mice treated (HFD + AICAR) or not treated (HFD) with AICAR was achieved by tamoxifen injection. TA muscle was injured by CTX injection following tamoxifen injection. Muscle was collected 1 h after the last AICAR treatment. A: H-E staining of TA muscle at 3 and 7 days postinjury (dpi) showing necrotic muscle fibers (#) and regenerating muscle fibers (*). B: IHC staining of EMH+ satellite cells in TA muscle at 3 and 7 dpi and quantification. C: IHC staining of Pax7+ satellite cells in TA muscle at 3 and 7 dpi and quantification. The dotted-line inset on each image shows magnification of the area marked by the solid-line box. D: FACS for Lin/Sca-1/integrin α7+ satellite cells at 7 dpi. E: Pax7, Myf5, MyoD, and myogenin mRNA levels in TA muscle at 3 dpi. F: Western blot analysis of p-AMPKα and AMPKα levels in muscle at 3 dpi. Data are mean ± SEM (n = 3). Scale bars = 200 μm.

Similar articles

Cited by

References

    1. Schenk S, Horowitz JF. Acute exercise increases triglyceride synthesis in skeletal muscle and prevents fatty acid-induced insulin resistance. J Clin Invest 2007;117:1690–1698 - PMC - PubMed
    1. Youn JY, Cai H. Fueling up skeletal muscle to reduce obesity: a TrkB story. Chem Biol 2015;22:311–312 - PMC - PubMed
    1. Kennedy JW, Hirshman MF, Gervino EV, et al. . Acute exercise induces GLUT4 translocation in skeletal muscle of normal human subjects and subjects with type 2 diabetes. Diabetes 1999;48:1192–1197 - PubMed
    1. Armstrong RB, Warren GL, Warren JA. Mechanisms of exercise-induced muscle fibre injury. Sports Med 1991;12:184–207 - PubMed
    1. Darr KC, Schultz E. Exercise-induced satellite cell activation in growing and mature skeletal muscle. J Appl Physiol (1985) 1987;63:1816–1821 - PubMed

Publication types

MeSH terms