. 2015 Sep 17;5(11):2441-52.
doi: 10.1534/g3.115.020164.

De Novo Assembly and Characterization of Four Anthozoan (Phylum Cnidaria) Transcriptomes

Affiliations

De Novo Assembly and Characterization of Four Anthozoan (Phylum Cnidaria) Transcriptomes

Sheila A Kitchen et al. G3 (Bethesda). .

Abstract

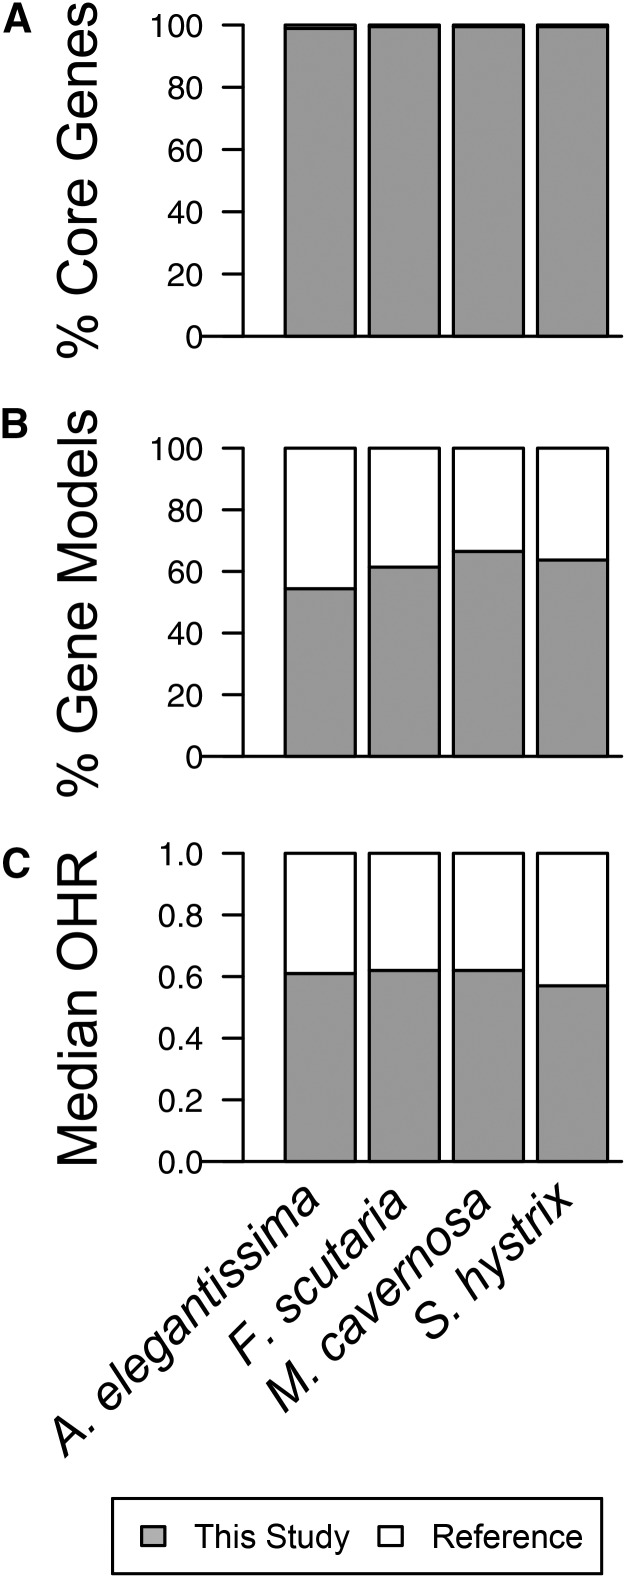
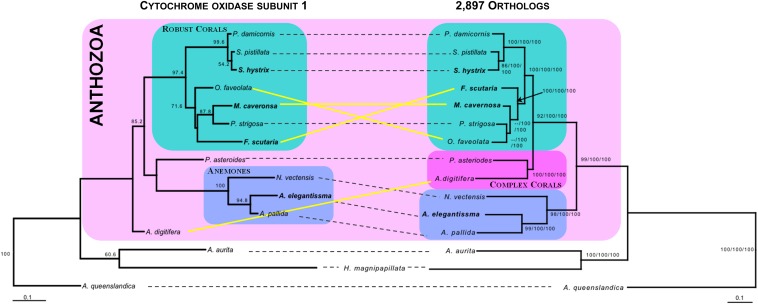
Many nonmodel species exemplify important biological questions but lack the sequence resources required to study the genes and genomic regions underlying traits of interest. Reef-building corals are famously sensitive to rising seawater temperatures, motivating ongoing research into their stress responses and long-term prospects in a changing climate. A comprehensive understanding of these processes will require extending beyond the sequenced coral genome (Acropora digitifera) to encompass diverse coral species and related anthozoans. Toward that end, we have assembled and annotated reference transcriptomes to develop catalogs of gene sequences for three scleractinian corals (Fungia scutaria, Montastraea cavernosa, Seriatopora hystrix) and a temperate anemone (Anthopleura elegantissima). High-throughput sequencing of cDNA libraries produced ~20-30 million reads per sample, and de novo assembly of these reads produced ~75,000-110,000 transcripts from each sample with size distributions (mean ~1.4 kb, N50 ~2 kb), comparable to the distribution of gene models from the coral genome (mean ~1.7 kb, N50 ~2.2 kb). Each assembly includes matches for more than half the gene models from A. digitifera (54-67%) and many reasonably complete transcripts (~5300-6700) spanning nearly the entire gene (ortholog hit ratios ≥0.75). The catalogs of gene sequences developed in this study made it possible to identify hundreds to thousands of orthologs across diverse scleractinian species and related taxa. We used these sequences for phylogenetic inference, recovering known relationships and demonstrating superior performance over phylogenetic trees constructed using single mitochondrial loci. The resources developed in this study provide gene sequences and genetic markers for several anthozoan species. To enhance the utility of these resources for the research community, we developed searchable databases enabling researchers to rapidly recover sequences for genes of interest. Our analysis of de novo assembly quality highlights metrics that we expect will be useful for evaluating the relative quality of other de novo transcriptome assemblies. The identification of orthologous sequences and phylogenetic reconstruction demonstrates the feasibility of these methods for clarifying the substantial uncertainties in the existing scleractinian phylogeny.

Keywords: coral; database; nonmodel system; phylogenomics.


Figures

Figure 1
Figure 1
Annotation pipeline used to classify origins of each assembled transcript. A series of sequence comparisons was performed comparing each transcript against N. vectensis rRNA (SILVA: ABAV01023297, ABAV01023333), A. tenuis mitochondrial DNA (NCBI: NC_003522.1), A. digitifera and S. minutum gene models, and the NCBI nonredundant protein database (bit-score threshold of 45 for small databases; E value threshold of 10−5 for large databases). Transcripts were assigned to categories by evaluating their similarity to each database in the order shown (see Materials and Methods for details).
Figure 2
Figure 2
Three metrics used to evaluate gene representation and assembly of complete transcripts in de novo transcriptome assemblies. (A) Percent of core eukaryotic genes (CEGMA) identified in each assembly. (B) Percent of A. digitifera gene models with significant matches in each assembly. (C) Median proportion of each N. vectensis protein aligned with transcripts in each assembly (OHRHITS). Gray = our transcriptome assembly compared to the respective reference for each analysis.
Figure 3
Figure 3
Distribution of functional categories (GO terms) in each transcriptome assembly. The percentage of transcripts with GO annotation for each category under the three main ontology domains was calculated for each assembly.
Figure 4
Figure 4
Predicted taxonomic origin of transcriptomes based on homology searches with BLAST. The percent of transcripts that were assigned to rRNA (purple), mtDNA (blue), dinoflagellate (green), metazoan (pink), other taxa (orange), and no match (gray) are shown.
Figure 5
Figure 5
Discordance in maximum likelihood phylogenetic reconstruction of COI compared to a combined phylogeny of concatenated ND (2, 4, and 5) genes and two phylogenomic trees. The COI phylogeny is presented on the left and the combined phylogeny is presented on the right. Topology for the ND mitochondrial set, relaxed and conservative phylogenomic trees were nearly identical. Therefore, nodal support is summarized on the relaxed tree (right). Bootstrap support at the nodes from left to right represents ND gene set/relaxed/conservative. If topologies differed in the summary tree, then the nodal support is presented - - as next to the node. Yellow solid lines connect taxon with different positions and/or relationships between the two trees, whereas black dashed lines connect those with the same position and/or relationship. Reconstructions of groups in the class Anthozoa based on Kitahara et al. (2010) are highlighted in boxes: teal= robust corals; dark pink = complex corals; and light blue = anemones. The names of species used in this study are emphasized by bold font. Scale bars indicate the amino acid replacements per site.

Similar articles

Cited by

References

    1. Abascal F., Zardoya R., Posada D., 2005. ProtTest: selection of best-fit models of protein evolution. Bioinformatics 21: 2104–2105. - PubMed
    1. Ashburner M., Ball C. A., Blake J. A., Botstein D., Butler H., et al. , 2000. Gene ontology: tool for the unification of biology. Nature Genetics 25: 25–29. - PMC - PubMed
    1. Altschul S. F., Gish W., Miller W., Myers E. W., Lipman D. J., 1990. Basic local alignment search tool. J. Mol. Biol. 215: 403–410. - PubMed
    1. Barshis D. J., Ladner J. T., Oliver T. A., Seneca F. O., Traylor-Knowles N., et al. , 2013. Genomic basis for coral resilience to climate change. Proc. Natl. Acad. Sci. USA 110: 1387–1392. - PMC - PubMed
    1. Baumgarten S., Simakov O., Esherick L. Y., Liew Y. J., Lehnert E. M., et al. , 2015. The genome of Aiptasia, a sea anemone model for coral symbiosis. Proc. Natl. Acad. Sci. USA 112: 11893–11898. - PMC - PubMed

Publication types