. 2015 Nov;138(Pt 11):3327-44.
doi: 10.1093/brain/awv259. Epub 2015 Sep 17.

Selective vulnerability of Rich Club brain regions is an organizational principle of structural connectivity loss in Huntington's disease

Collaborators, Affiliations

Selective vulnerability of Rich Club brain regions is an organizational principle of structural connectivity loss in Huntington's disease

Peter McColgan et al. Brain. 2015 Nov.

Abstract

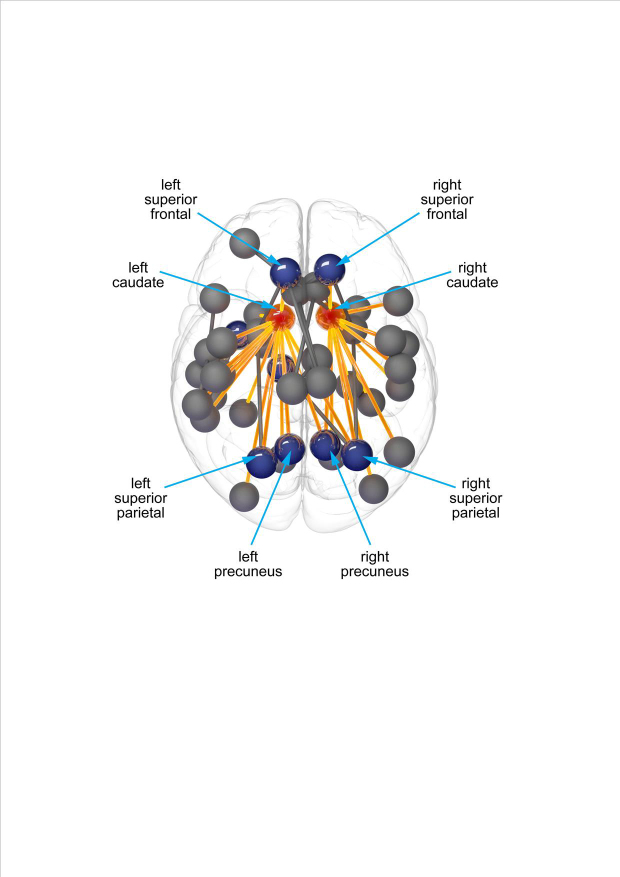
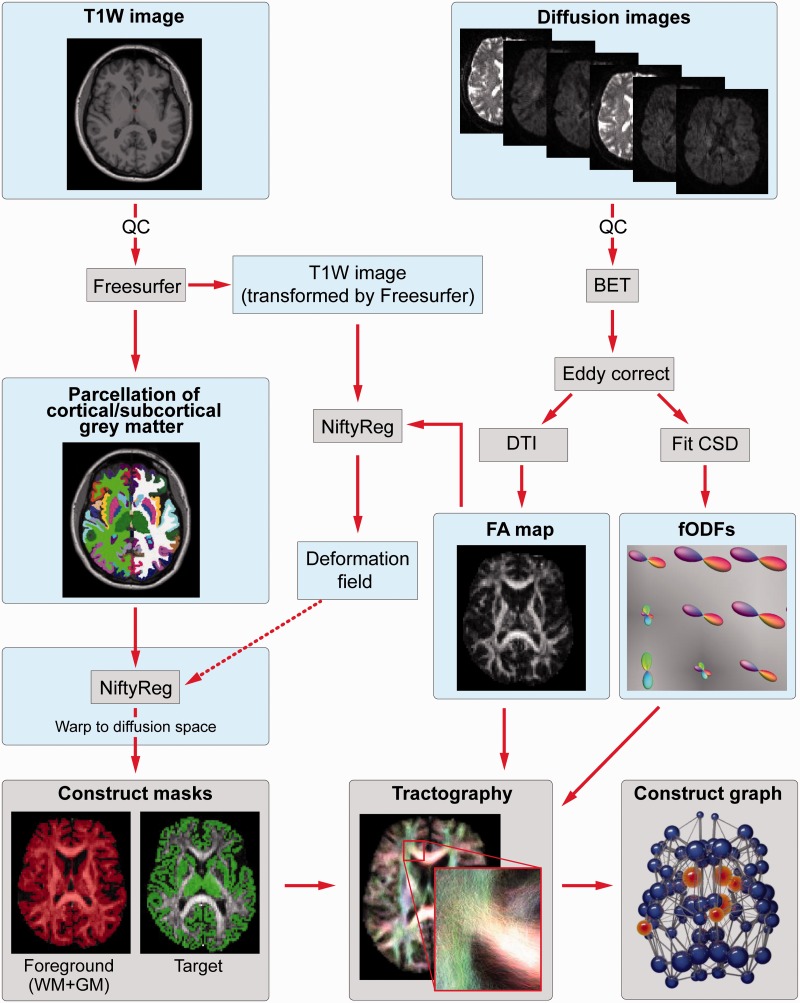
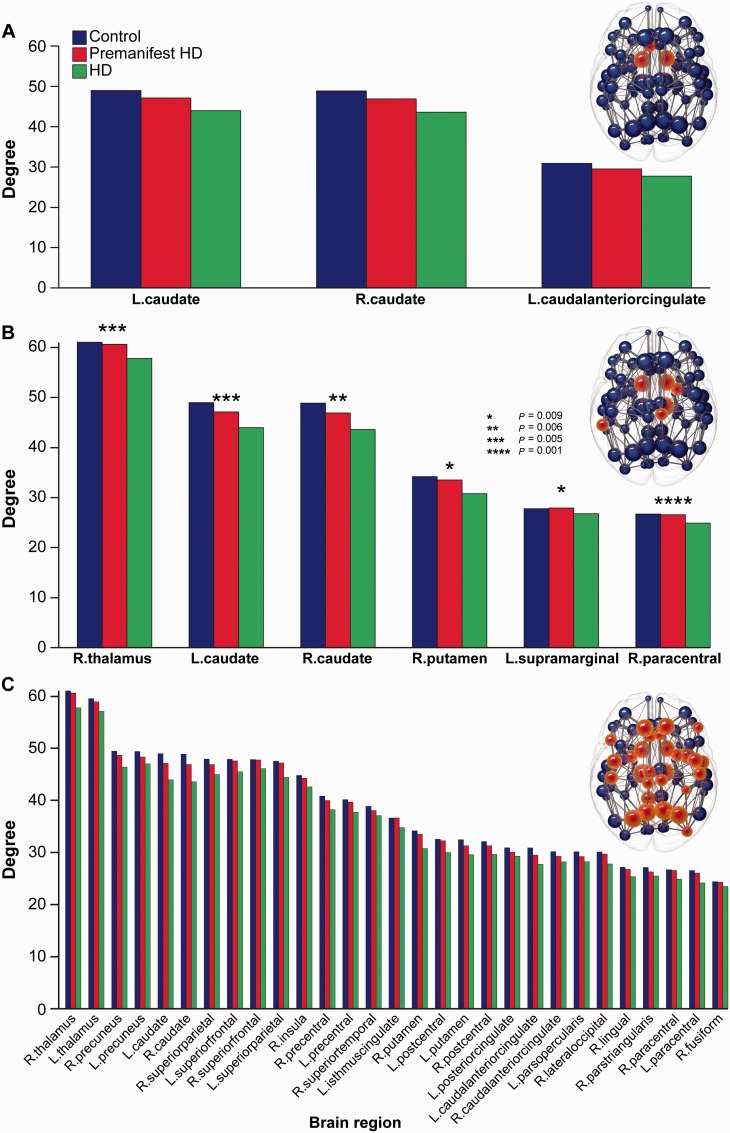
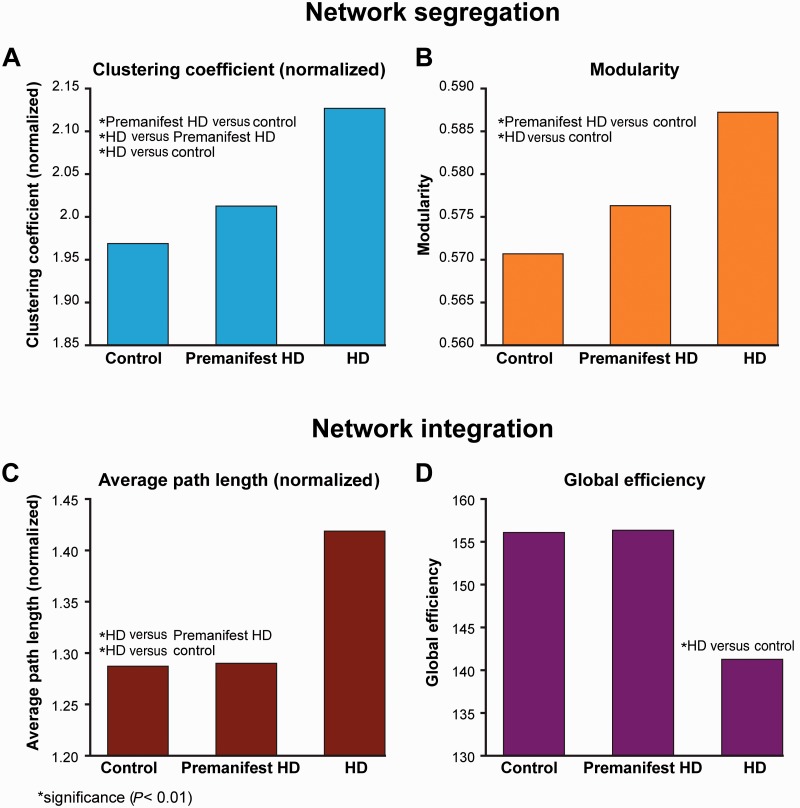
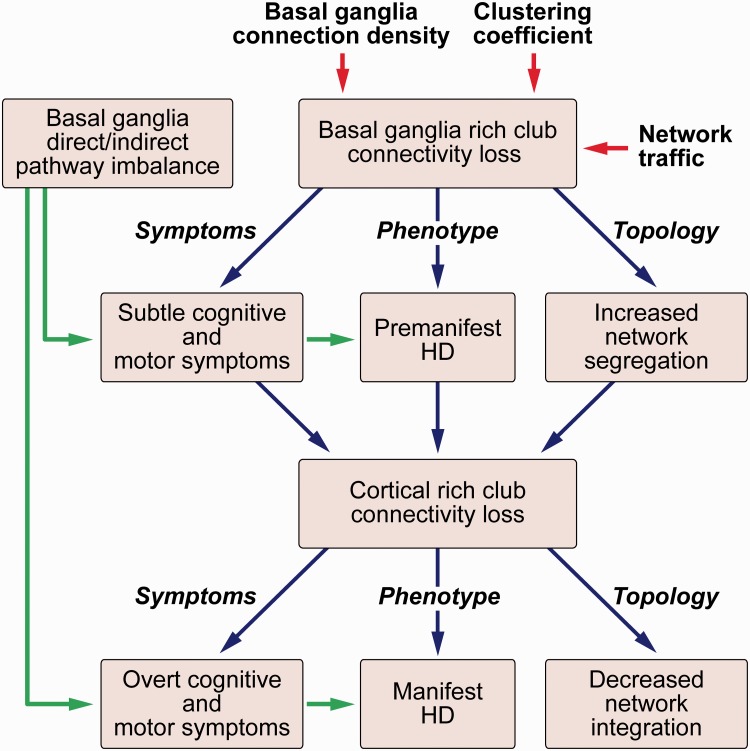
Huntington's disease can be predicted many years before symptom onset, and thus makes an ideal model for studying the earliest mechanisms of neurodegeneration. Diffuse patterns of structural connectivity loss occur in the basal ganglia and cortex early in the disease. However, the organizational principles that underlie these changes are unclear. By understanding such principles we can gain insight into the link between the cellular pathology caused by mutant huntingtin and its downstream effect at the macroscopic level. The 'rich club' is a pattern of organization established in healthy human brains, where specific hub 'rich club' brain regions are more highly connected to each other than other brain regions. We hypothesized that selective loss of rich club connectivity might represent an organizing principle underlying the distributed pattern of structural connectivity loss seen in Huntington's disease. To test this hypothesis we performed diffusion tractography and graph theoretical analysis in a pseudo-longitudinal study of 50 premanifest and 38 manifest Huntington's disease participants compared with 47 healthy controls. Consistent with our hypothesis we found that structural connectivity loss selectively affected rich club brain regions in premanifest and manifest Huntington's disease participants compared with controls. We found progressive network changes across controls, premanifest Huntington's disease and manifest Huntington's disease characterized by increased network segregation in the premanifest stage and loss of network integration in manifest disease. These regional and whole brain network differences were highly correlated with cognitive and motor deficits suggesting they have pathophysiological relevance. We also observed greater reductions in the connectivity of brain regions that have higher network traffic and lower clustering of neighbouring regions. This provides a potential mechanism that results in a characteristic pattern of structural connectivity loss targeting highly connected brain regions with high network traffic and low clustering of neighbouring regions. Our findings highlight the role of the rich club as a substrate for the structural connectivity loss seen in Huntington's disease and have broader implications for understanding the connection between molecular and systems level pathology in neurodegenerative disease.

Keywords: Huntington’s disease; rich club; tractography.


Figures

None
Diffuse structural connectivity loss occurs early in Huntington’s disease. However, the organizational principles underlying these changes are unclear. Using whole brain diffusion tractography and graph theoretical analysis, McColgan, Seunarine et al. identify a specific role for highly connected rich club regions as a substrate for structural connectivity loss in Huntington’s disease.
Figure 1
Figure 1
Summary of processing pipeline. BET = Brain Extraction Tool; CSD = constrained spherical deconvolution; DTI = diffusion tensor imaging; FA = fractional anisotropy; fODF = fibre orientation distribution function; GM = grey matter; QC = quality control; WM = white matter.
Figure 2
Figure 2
Group differences in degree. Significant group differences in degree for (A) premanifest Huntington’s disease versus controls (P = 0.01 for all regions), (B) Huntington’s versus premanifest Huntington’s disease (*P = 0.009, **P = 0.006, ***P = 0.005, ****P = 0.001) and (C) Huntington’s disease versus controls. For C, only those regions with P < 0.0003 are displayed to highlight the most significant regions. Controls (blue, left columns), premanifest Huntington's disease (red, centre columns) and Huntington's disease (green right columns) are presented in each graph to illustrate consistent step-wise reductions in degree across groups. A brain network is displayed above each bar chart. Spheres represent brain regions with red spheres indicating the brain regions showing significance between groups. Data are represented as a group mean (confidence intervals are not included as not standard for permutation tests).
Figure 3
Figure 3
Group differences in network segregation and integration. Segregation: (A) normalized clustering coefficient (B) modularity. Integration: (C) normalized average path length and (D) global efficiency. *P < 0.01. Data are represented as a group mean (confidence intervals are not included as not standard for permutation tests). HD = Huntington’s disease.
Figure 4
Figure 4
Network-based statistics analysis showing significantly reduced connectivity between premanifest Huntington’s disease versus controls in cortico-caudate connections. Red = caudate; blue = cortical rich club regions; yellow = cortico-caudate connections.
Figure 5
Figure 5
Corticobasal ganglia connectivity univariate analysis. Group differences between (A) premanifest Huntington’s disease (HD) versus controls (*P = 0.008, **P = 0.006, ***P = 0.004, ****P = 0.003), (B) Huntington’s disease versus premanifest Huntington’s disease, and (C) Huntington’s disease versus controls. Only those connections with (A) P < 0.009, (B) and (C) P < 0.002 are displayed to highlight most significant connections. Data are represented as a group mean (confidence intervals are not included as not standard for permutation tests). Controls are shown in blue, left columns; premanifest Huntington’s disease is shown in red, centre columns; and Huntington’s disease is shown in green, right columns.
Figure 6
Figure 6
VCP across groups. (A) Caudate, (B) putamen, and (C) thalamus. Labels are combined as follows: parietal = superior and inferior, orbitofrontal = lateral and medial, temporal = inferior, middle and superior. Each label list corresponds to the colour in the legend to the left of it. Label lists are displayed in black and red font alternately for ease of viewing.
Figure 7
Figure 7
Selective vulnerability analysis. (A) Correlation of average control streamline density against group differences in streamline density [based on graph theoretical analysis (volume un-normalized)]; each data point represents a single brain connection. (B) Correlation of average control corticobasal ganglia streamline density against group differences in streamline density [based on corticobasal ganglia connectivity analysis (volume normalized)]; each data point represents a single corticobasal ganglia connection. (C) Correlation of average control brain region network traffic against group differences in (graph theory) strength [based on graph theoretical analysis (volume un-normalized)]; each data point represents a single region of interest. (D) Correlation of average control clustering coefficient against group differences in degree [based on graph theoretical analysis (volume un-normalized)]; each data point represents a single region of interest. HD = Huntington’s disease.
Figure 8
Figure 8
Summary of findings. There is selective loss of basal ganglia rich club connectivity due to high higher connection to the basal ganglia, higher network traffic and reduced clustering coefficients of rich club regions. This results in increased network segregation leading to the subtle motor and cognitive symptoms seen in premanifest Huntington’s disease. Further loss of cortical rich club connectivity results in reduced network integration resulting in the overt cognitive and motor symptoms seen in manifest Huntington’s disease. HD = Huntington’s disease.

References

    1. Andre VM, Fisher YE, Levine MS. Altered balance of activity in the striatal direct and indirect pathways in mouse models of Huntington's disease. Front Syst Neurosci 2011; 5: 46. - PMC - PubMed
    1. Baggio HC, Segura B, Junque C, de Reus MA, Sala-Llonch R, Van den Heuvel MP. Rich club organization and cognitive performance in healthy older participants. J Cogn Neurosci 2015; 27: 1801–10. - PubMed
    1. Bai F, Shu N, Yuan Y, Shi Y, Yu H, Wu D, et al. Topologically convergent and divergent structural connectivity patterns between patients with remitted geriatric depression and amnestic mild cognitive impairment. J Neurosci 2012; 32: 4307–18. - PMC - PubMed
    1. Behrens TE, Berg HJ, Jbabdi S, Rushworth MF, Woolrich MW. Probabilistic diffusion tractography with multiple fibre orientations: what can we gain? Neuroimage 2007;34:144–55. - PMC - PubMed
    1. Bohanna I, Georgiou-Karistianis N, Egan GF. Connectivity-based segmentation of the striatum in Huntington's disease: vulnerability of motor pathways. Neurobiol Dis 2011; 42: 475–81. - PubMed

Publication types