. 2016 Mar;15(3):1105-16.
doi: 10.1074/mcp.M115.048504. Epub 2015 Sep 18.

Serum Albumin Domain Structures in Human Blood Serum by Mass Spectrometry and Computational Biology

Affiliations

Serum Albumin Domain Structures in Human Blood Serum by Mass Spectrometry and Computational Biology

Adam Belsom et al. Mol Cell Proteomics. 2016 Mar.

Abstract

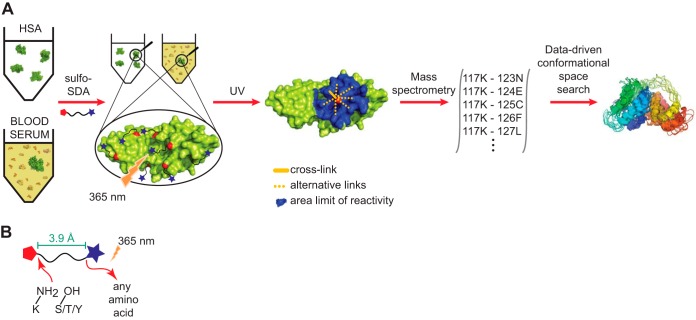
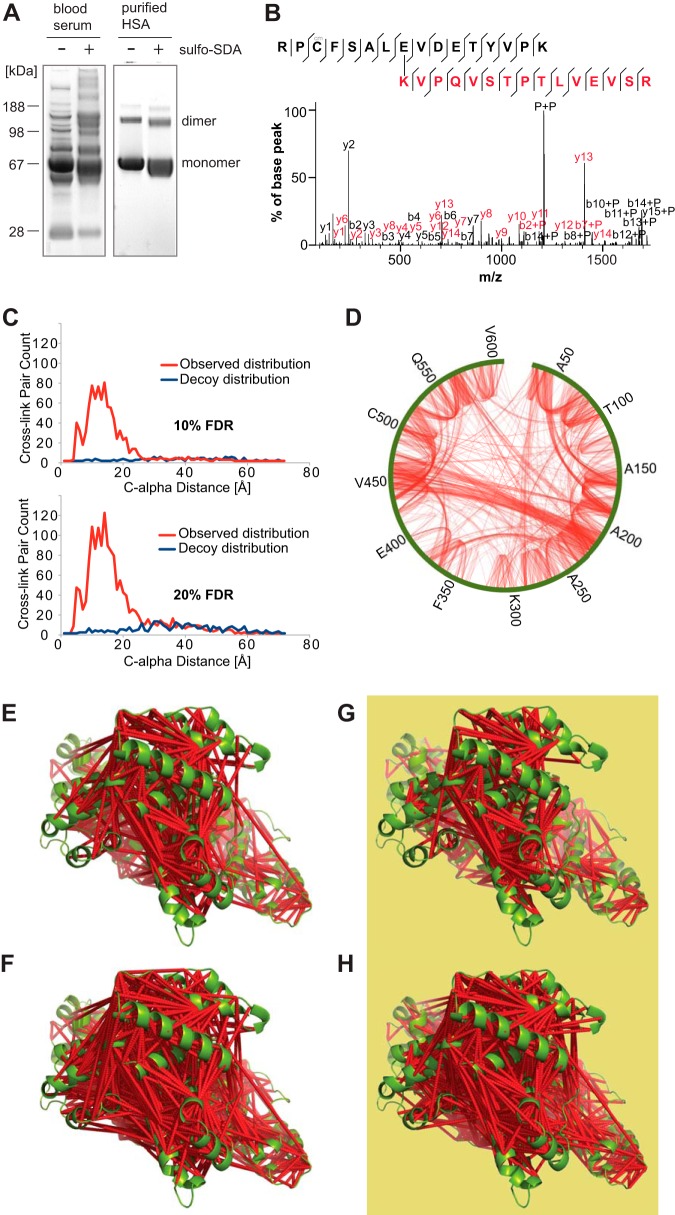
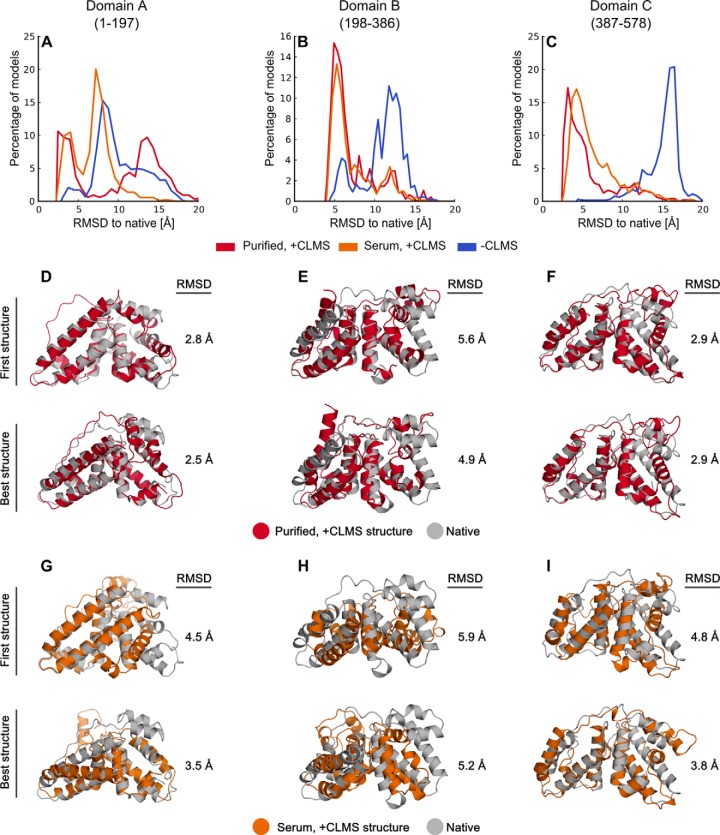
Chemical cross-linking combined with mass spectrometry has proven useful for studying protein-protein interactions and protein structure, however the low density of cross-link data has so far precluded its use in determining structures de novo. Cross-linking density has been typically limited by the chemical selectivity of the standard cross-linking reagents that are commonly used for protein cross-linking. We have implemented the use of a heterobifunctional cross-linking reagent, sulfosuccinimidyl 4,4'-azipentanoate (sulfo-SDA), combining a traditional sulfo-N-hydroxysuccinimide (sulfo-NHS) ester and a UV photoactivatable diazirine group. This diazirine yields a highly reactive and promiscuous carbene species, the net result being a greatly increased number of cross-links compared with homobifunctional, NHS-based cross-linkers. We present a novel methodology that combines the use of this high density photo-cross-linking data with conformational space search to investigate the structure of human serum albumin domains, from purified samples, and in its native environment, human blood serum. Our approach is able to determine human serum albumin domain structures with good accuracy: root-mean-square deviation to crystal structure are 2.8/5.6/2.9 Å (purified samples) and 4.5/5.9/4.8Å (serum samples) for domains A/B/C for the first selected structure; 2.5/4.9/2.9 Å (purified samples) and 3.5/5.2/3.8 Å (serum samples) for the best out of top five selected structures. Our proof-of-concept study on human serum albumin demonstrates initial potential of our approach for determining the structures of more proteins in the complex biological contexts in which they function and which they may require for correct folding. Data are available via ProteomeXchange with identifier PXD001692.


Figures

Fig. 1.
Fig. 1.
Workflow of photo-cross-linking/mass spectrometry combined with computational conformational space search. A, purified HSA and human blood serum were cross-linked using photo-reactive sulfo-SDA in a two-step procedure. Proteins are first decorated by the cross-linker at Lys, Ser, Thr, Tyr and N terminus. Upon UV activation, the cross-linker links these residues to a nearby residue. The cross-linked protein is then subjected to a proteomic workflow, consisting of trypsin-digestion, liquid chromatography-mass spectrometry and database searching to identify the cross-linked residues. These intramolecular proximities are then used as experimental constraints during computational conformational space search. B, schematic view of the cross-linker.
Fig. 2.
Fig. 2.
Purified HSA and HSA in blood serum and mass spectrometry. A, blood serum proteins and purified HSA, with (+) and without (-) sulfo-SDA cross-linking. B, high-resolution fragmentation spectrum of SDA cross-linked peptides that reveals the intramolecular proximity of K437 and E492. C, FDR analysis showing observed distance distribution in comparison to the decoy distance distribution. The plot shows the residue-residue C-alpha distances of cross-linked residues and decoy database hits as observed in the crystal structure PDB 1AO6 for the respective residue pairs. D, cross-link network (n = 1,495, 20% FDR) for purified HSA. Green outer line represents the sequence of HSA. E and F, cross-linked residue pairs of purified HSA in PDB 1AO6: E, n = 881, 10% FDR; F, n = 1,495, 20% FDR. G and H, cross-linked residue pairs of blood serum HSA in PDB 1AO6: G, n = 644, 10% FDR; H, n = 1,304, 20% FDR.
Fig. 3.
Fig. 3.
Extracted ion chromatogram of a cross-linked peptide pair. Cross-linked peptide pair labeled with sequence number with first peptide match shown in black and second peptide match in red. K375 found cross-linked to three residues (R233, E232, and A234) in the second peptide in a single LC-MS run. Peaks in the extracted ion chromatogram (97.67, 98.38 and 99.45 mins) are labeled with the sites of cross-linking in the peptide pair matched by the database search software, Xi. C-alpha distances are indicated on cross-linked residue pairs. Fragmentation spectra for each cross-linked peptide pair are shown at the bottom as evidence of identification. Fully annotated spectra are provided in supplemental Fig. 10.
Fig. 4.
Fig. 4.
Identified cross-linked sites suggest alpha-helical secondary structure. K186 from peptide two (sequence shown in red) found cross-linked to five residues (F151, E155, E156, L159 and Y162) from peptide one (sequence shown in black). The full sequences of peptides identified as cross-linked peptide pairs are shown at the top right, with an expansion of the sequence showing residues cross-linked to K186 shown underneath. Residues from the sequence of peptide one are shown assembled in a representation of an alpha-helix, beginning with A150 and ending with Y162. Residues identified as cross-linked to K186 are colored red, with the associated fragmentation spectra for each cross-linked peptide pair shown as evidence of identification. C-alpha distances are associated with each cross-linked residue pair. Fully annotated spectra are provided in supplemental Fig. 11.
Fig. 5.
Fig. 5.
Determined structures for the individual domains of HSA by using cross-link constraints and conformational space search. A–C, deviation of domain structures obtained with our novel procedure to the crystal structure of HSA (PDB 1AO6). CLMS data from purified and serum HSA (red and orange curve) increases the sampling of low-RMSD structures, compared with structures obtained without CLMS data (blue curve). D-F, first and best determined structures calculated with CLMS data from purified HSA, aligned to the crystal structures of the HSA domains. For each domain, “First structure” refers to the single structure we selected using Rosetta energy+CLMS constraints. “Best structure” refers to the lowest RMSD structure to PDB 1AO6 among the best five structures ranked by Rosetta energy+GOAP (see “Experimental Procedures”). G–I, first and best determined structures calculated with CLMS data from HSA samples in serum. Large loops in the crystal structure and terminal residues predicted to be disordered are removed for RMSD computation (see “Experimental Procedures”). The following residues are used for calculation of the RMSD: 2–71:115–194 for domain A, 200–262:308–381 for domain B and 389–458:508–571 for domain C.

References

    1. Carpenter E. P., Beis K., Cameron A. D., and Iwata S. (2008) Overcoming the challenges of membrane protein crystallography. Curr. Opin. Struct. Biol. 18, 581–586 - PMC - PubMed
    1. Caffrey M. (2003) Membrane protein crystallization. J. Struct. Biol. 142, 108–132 - PubMed
    1. Rappsilber J., Siniossoglou S., Hurt E. C., and Mann M. (1999) A generic strategy to analyze the spatial organization of multi-protein complexes by cross-linking and mass spectrometry. Anal. Chem. 72, 267–275 - PubMed
    1. Boutet S., Lomb L., Williams G. J., Barends T. R. M., Aquila A., Doak R. B., Weierstall U., DePonte D. P., Steinbrener J., Shoeman R. L., Messerschmidt M., Barty A., White T. A., Kassemeyer S., Kirian R. A., Seibert M. M., Montanez P. A., Kenney C., Herbst R., Hart P., Pines J., Haller G., Gruner S. M., Philipp H. T., Tate M. W., Hromalik M., Koerner L. J., van Bakel N., Morse J., Ghonsalves W., Arnlund D., Bogan M. J., Caleman C., Fromme R., Hampton C. Y., Hunter M. S., Johansson L. C., Katona G., Kupitz C., Liang M., Martin A. V., Nass K., Redecke L., Stellato F., Timneanu N., Wang D., Zatsepin N. A., Schafer D., Defever J., Neutze R., Fromme P., Spence J. C. H., Chapman H. N., and Schlichting I. (2012) High-resolution protein structure determination by serial femtosecond crystallography. Science 337, 362–364 - PMC - PubMed
    1. Grigorieff N. (2013) Direct detection pays off for electron cryo-microscopy. Elife 2, e00573. - PMC - PubMed

Publication types

Associated data