Multi-level omics analysis in a murine model of dystrophin loss and therapeutic restoration
- PMID: 26385637
- PMCID: PMC4634378
- DOI: 10.1093/hmg/ddv381
Multi-level omics analysis in a murine model of dystrophin loss and therapeutic restoration
Abstract
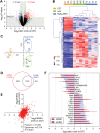
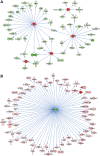
Duchenne muscular dystrophy (DMD) is a classical monogenic disorder, a model disease for genomic studies and a priority candidate for regenerative medicine and gene therapy. Although the genetic cause of DMD is well known, the molecular pathogenesis of disease and the response to therapy are incompletely understood. Here, we describe analyses of protein, mRNA and microRNA expression in the tibialis anterior of the mdx mouse model of DMD. Notably, 3272 proteins were quantifiable and 525 identified as differentially expressed in mdx muscle (P < 0.01). Therapeutic restoration of dystrophin by exon skipping induced widespread shifts in protein and mRNA expression towards wild-type expression levels, whereas the miRNome was largely unaffected. Comparison analyses between datasets showed that protein and mRNA ratios were only weakly correlated (r = 0.405), and identified a multitude of differentially affected cellular pathways, upstream regulators and predicted miRNA-target interactions. This study provides fundamental new insights into gene expression and regulation in dystrophic muscle.
© The Author 2015. Published by Oxford University Press.
Figures


Similar articles
-
Molecular correction of Duchenne muscular dystrophy by splice modulation and gene editing.RNA Biol. 2021 Jul;18(7):1048-1062. doi: 10.1080/15476286.2021.1874161. Epub 2021 Jan 20. RNA Biol. 2021. PMID: 33472516 Free PMC article. Review.
-
miR-146a deficiency does not aggravate muscular dystrophy in mdx mice.Skelet Muscle. 2019 Aug 14;9(1):22. doi: 10.1186/s13395-019-0207-0. Skelet Muscle. 2019. PMID: 31412923 Free PMC article.
-
Mdx mice inducibly expressing dystrophin provide insights into the potential of gene therapy for duchenne muscular dystrophy.Hum Mol Genet. 2000 Oct 12;9(17):2507-15. doi: 10.1093/hmg/9.17.2507. Hum Mol Genet. 2000. PMID: 11030755
-
Enhanced in vivo delivery of antisense oligonucleotides to restore dystrophin expression in adult mdx mouse muscle.FEBS Lett. 2003 Sep 25;552(2-3):145-9. doi: 10.1016/s0014-5793(03)00904-9. FEBS Lett. 2003. PMID: 14527677
-
Progress toward Gene Therapy for Duchenne Muscular Dystrophy.Mol Ther. 2017 May 3;25(5):1125-1131. doi: 10.1016/j.ymthe.2017.02.019. Epub 2017 Apr 15. Mol Ther. 2017. PMID: 28416280 Free PMC article. Review.
Cited by
-
mRNA and microRNA transcriptomics analyses in a murine model of dystrophin loss and therapeutic restoration.Genom Data. 2015 Dec 2;7:88-9. doi: 10.1016/j.gdata.2015.11.025. eCollection 2016 Mar. Genom Data. 2015. PMID: 26981371 Free PMC article.
-
Peroxisome Proliferator-activated Receptor γ Coactivator-1 α Isoforms Selectively Regulate Multiple Splicing Events on Target Genes.J Biol Chem. 2016 Jul 15;291(29):15169-84. doi: 10.1074/jbc.M115.705822. Epub 2016 May 26. J Biol Chem. 2016. PMID: 27231350 Free PMC article.
-
miR-486 is essential for muscle function and suppresses a dystrophic transcriptome.Life Sci Alliance. 2022 May 5;5(9):e202101215. doi: 10.26508/lsa.202101215. Print 2022 Sep. Life Sci Alliance. 2022. PMID: 35512829 Free PMC article.
-
A deep redox proteome profiling workflow and its application to skeletal muscle of a Duchenne Muscular Dystrophy model.Free Radic Biol Med. 2022 Nov 20;193(Pt 1):373-384. doi: 10.1016/j.freeradbiomed.2022.10.300. Epub 2022 Oct 25. Free Radic Biol Med. 2022. PMID: 36306991 Free PMC article.
-
Molecular correction of Duchenne muscular dystrophy by splice modulation and gene editing.RNA Biol. 2021 Jul;18(7):1048-1062. doi: 10.1080/15476286.2021.1874161. Epub 2021 Jan 20. RNA Biol. 2021. PMID: 33472516 Free PMC article. Review.
References
-
- Hoffman E.P., Brown R.H. Jr, Kunkel L.M. (1987) Dystrophin: the protein product of the Duchenne muscular dystrophy locus. Cell, 51, 919–928. - PubMed
-
- Monaco A.P., Bertelson C.J., Liechti-Gallati S., Moser H., Kunkel L.M. (1988) An explanation for the phenotypic differences between patients bearing partial deletions of the DMD locus. Genomics, 2, 90–95. - PubMed
-
- Ervasti J.M., Campbell K.P. (1991) Membrane organization of the dystrophin-glycoprotein complex. Cell, 66, 1121–1131. - PubMed
-
- Campbell K.P. (1995) Three muscular dystrophies: loss of cytoskeleton-extracellular matrix linkage. Cell, 80, 675–679. - PubMed
Publication types
MeSH terms
Substances
Grants and funding
LinkOut - more resources
Full Text Sources
Other Literature Sources
Molecular Biology Databases

