. 2015 Sep 15;29(18):1942-54.
doi: 10.1101/gad.268896.115.

Molecular mechanisms of ribosomal protein gene coregulation

Affiliations

Molecular mechanisms of ribosomal protein gene coregulation

Rohit Reja et al. Genes Dev. .

Abstract

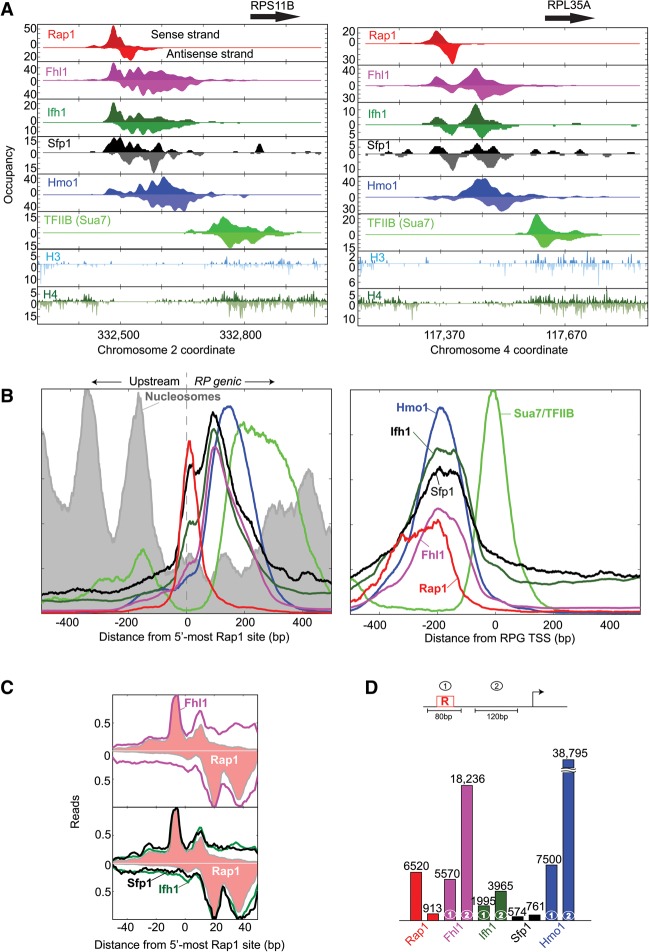
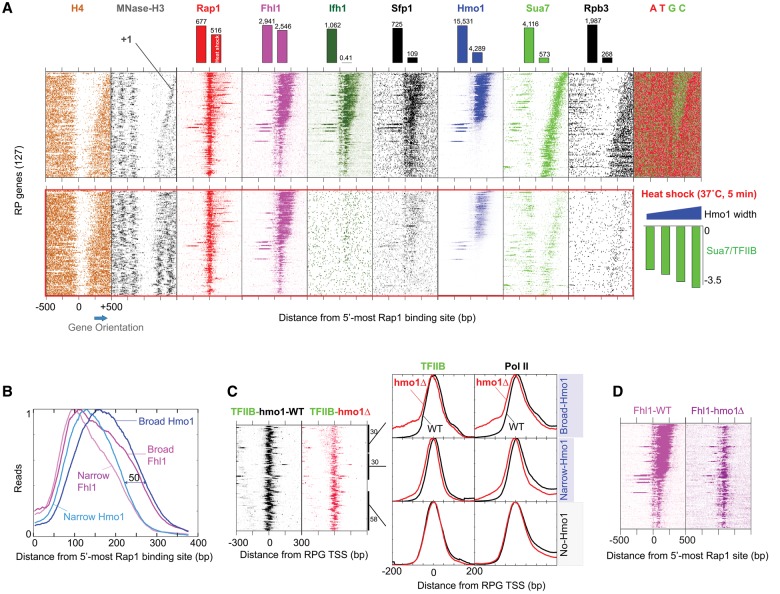
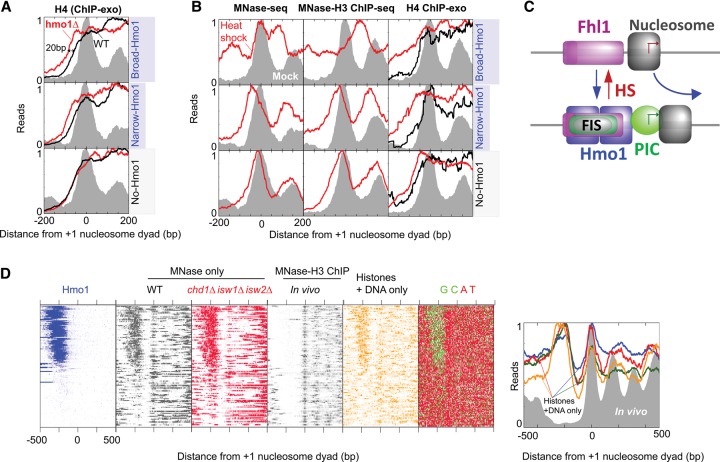
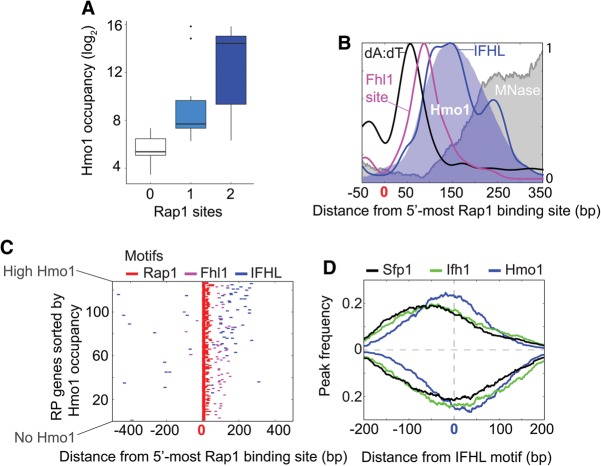
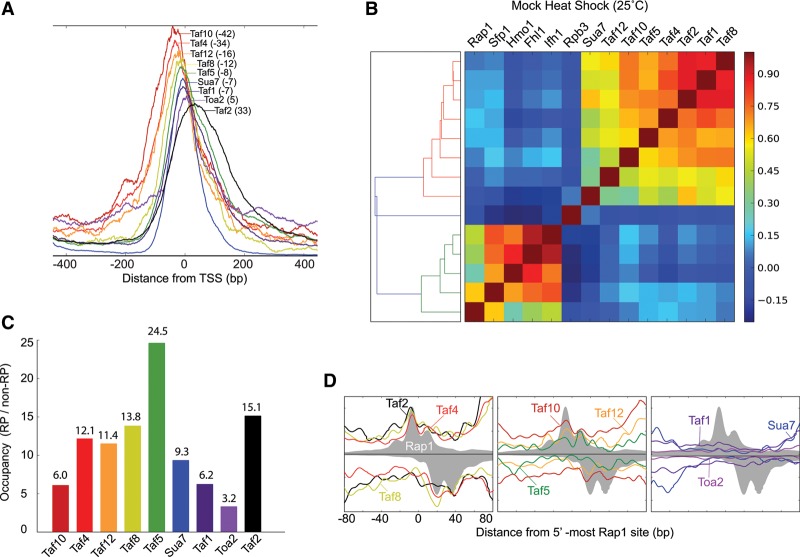
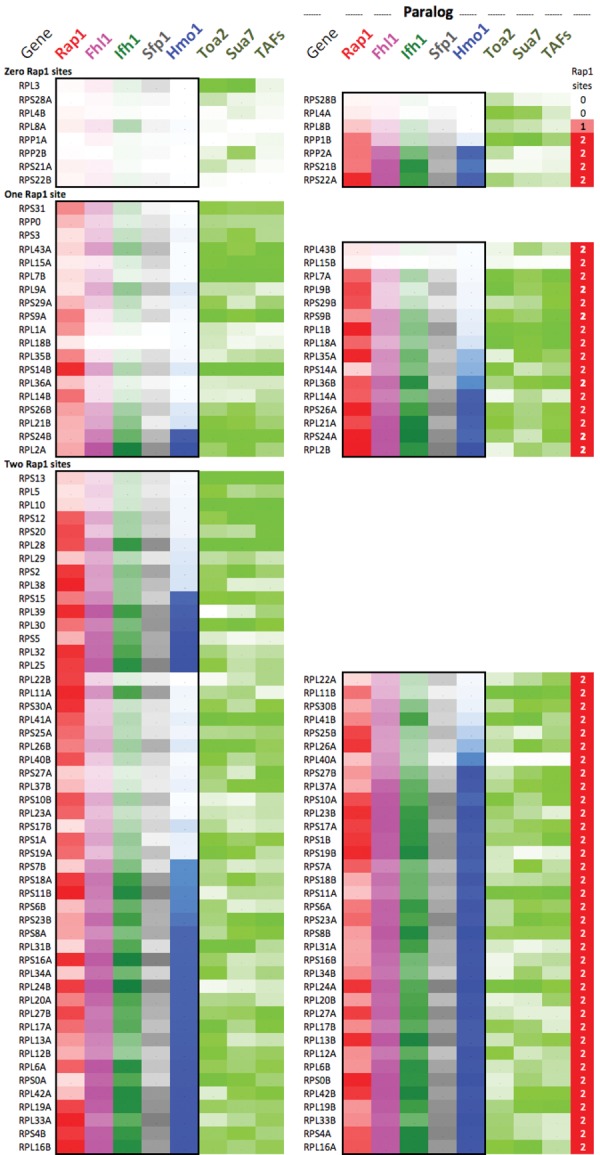
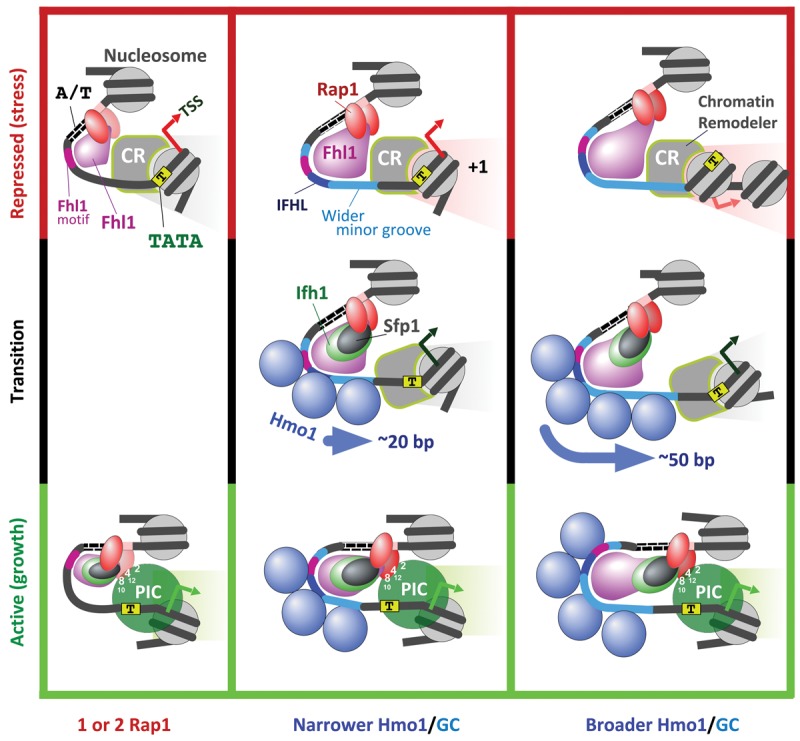
The 137 ribosomal protein genes (RPGs) of Saccharomyces provide a model for gene coregulation. We examined the positional and functional organization of their regulators (Rap1 [repressor activator protein 1], Fhl1, Ifh1, Sfp1, and Hmo1), the transcription machinery (TFIIB, TFIID, and RNA polymerase II), and chromatin at near-base-pair resolution using ChIP-exo, as RPGs are coordinately reprogrammed. Where Hmo1 is enriched, Fhl1, Ifh1, Sfp1, and Hmo1 cross-linked broadly to promoter DNA in an RPG-specific manner and demarcated by general minor groove widening. Importantly, Hmo1 extended 20-50 base pairs (bp) downstream from Fhl1. Upon RPG repression, Fhl1 remained in place. Hmo1 dissociated, which was coupled to an upstream shift of the +1 nucleosome, as reflected by the Hmo1 extension and core promoter region. Fhl1 and Hmo1 may create two regulatable and positionally distinct barriers, against which chromatin remodelers position the +1 nucleosome into either an activating or a repressive state. Consistent with in vitro studies, we found that specific TFIID subunits, in addition to cross-linking at the core promoter, made precise cross-links at Rap1 sites, which we interpret to reflect native Rap1-TFIID interactions. Our findings suggest how sequence-specific DNA binding regulates nucleosome positioning and transcription complex assembly >300 bp away and how coregulation coevolved with coding sequences.

Keywords: ChIP-seq; chromatin; gene regulation mechanisms; transcription factor.


Figures

Figure 1.
Figure 1.
Positional organization of RPG-specific factors. (A) Smoothed distribution of unshifted ChIP-exo tag 5′ ends (exonuclease stop sites) on forward and reverse (inverted) strands of RPS11B and RPL35A. (B) RPG-averaged 5′ ends of shifted tags (representing points of cross-linking) were plotted as a smoothed frequency distribution around the most upstream Rap1-binding site (left panel) or their TSS (right panel) and oriented such that the direction of transcription was to the right. The Y-axis scale is linear and starts from zero but is scaled to each factor for ease of visualization. Therefore, absolute areas under the curves are not comparable. (C) Frequency distribution of gene-averaged (n = 127) unshifted tag 5′ ends for Fhl1, Ifh1, and Sfp1 (magenta, green, and black traces) compared with the equivalent for Rap1 (pink-filled plots) and oriented with the TSS to the right. Tags on the antisense strand are inverted. The Y-axis is scaled to 1 for each. (D) Occupancy of RPG-specific factors at Rap1 sites and the downstream regions (see the diagram). Background-normalized occupancies at Rap1 sites were calculated by summing the tag counts for each factor from −40 to +40 bp from Rap1 sites and at downstream regions from +60 to +180 bp from Rap1 sites.
Figure 2.
Figure 2.
Regulation of PIC and Fhl1 positioning by Hmo1. (A) Heat map showing shifted ChIP-exo 5′ end tags for RPG regulators at each RPG, aligned by the 5′-most Rap1 site and sorted by the breadth of Hmo1 binding (i.e., the number of Hmo1-containing coordinates between Rap1 and TSS). “MNase-H3” refers to dyads of H3-immunoprecipitated MNase-digested nucleosomes. A nucleotide composition plot is shown at the right. The top and bottom sets of panels correspond to mock heat shock and acute heat shock (5 min at 37°C), which are quantified in the bar graphs. The bottom right bar graphs correspond to log2 fold changes in Sua7/TFIIB occupancy upon heat shock at various Hmo1-width quartiles. (B) Frequency distribution of Hmo1 tags around Rap1 sites at RPGs having broad (top 30 from A) versus narrow (next 30) Hmo1 occupancy. The Y-axis is scaled to 1 for each and is oriented with the TSS to the right. (C) Distribution of TFIIB and RNA polymerase II (Pol II) around TSSs of subsets of RPGs having broad, narrow, and no Hmo1 (bottom 58 from A), comparing wild-type (black) and hmo1Δ (red) strains. The left panel reports on individual genes sorted as in A, whereas the right set of graphs report on the averages within each group. n = 30, 30, and 58 for the top, middle, and bottom groups. Each trace is separately scaled to 1 on the Y-axis. (D) Distribution of Fhl1 in a hmo1Δ strain, sorted as in A.
Figure 3.
Figure 3.
Hmo1-regulated nucleosomal organization at RPGs. (A) Averaged distribution of histone H4 ChIP-exo tags around the +1 nucleosome dyad of RPGs in a wild-type (black) versus a hmo1Δ (red) strain. The gray fill represents nucleosome dyad distributions as measured by MNase (Shivaswamy et al. 2008). The three panels represent broad, narrow, and no Hmo1 binding. (B) Averaged distribution of MNase-resistant DNA fragments (no ChIP vs. H3 ChIP) and H4 ChIP-exo tags around the +1 nucleosome dyad of RPGs. Gray fill and red traces represent mock and 5-min 37°C heat shock, respectively. Data in the left panel are from Shivaswamy et al. (2008). The right panel shows H4 ChIP-exo from mock (black) and heat-shocked (red) cells, with MNase-H3 ChIP nucleosomes as gray fill. (C) Schematic of upstream nucleosome shift upon heat shock. (D) Distribution of MNase-resistant fragments on individual RPGs relative to the +1 nucleosome and sorted as in Figure 2A (breadth of Hmo1 binding). The first panel is Hmo1 ChIP-exo. MNase was used in the second through fifth panels without ChIP (second and third panels) or with histone H3 ChIP (fourth and fifth panels). A+T and G+C frequencies are shown in the sixth panel. “Histones + DNA only” composite plots reflect data consistency from a variety of sources (Kaplan et al. 2009; Zhang et al. 2009, 2011b) in orange, red, blue/green, respectively.
Figure 4.
Figure 4.
Organization of cis-regulatory elements at RPG promoters. (A) Box plot of log2 Hmo1 occupancy at RPGs with zero to two Rap1 sites. (B) Smoothed frequency distribution of >5-mer poly(dA:dT) tracts (black), Fhl1 motifs (magenta), and IFHL motifs (blue) around the most upstream Rap1 site. Nucleosomes (gray fill) and shifted 5′ end tags for Hmo1 (light-blue fill) are shown. Each trace is separately Y-axis-scaled to 1. (C) Distribution of Rap1 motifs (red; <40 bp from the primary motif), Fhl1 motifs (magenta), and IFHL motifs (blue) for each RPG around the most upstream Rap1 site, oriented with TSS to the right and sorted by Hmo1 occupancy. (D) Distribution of Sfp1 (black), Ifh1 (green), and Hmo1 (blue) ChIP-exo peak calls (GeneTrack, s5, and d20) around IFHL motifs, oriented so that RPG TSSs are to the right. Tag 5′ end distributions located on the antisense strand are shown inverted.
Figure 5.
Figure 5.
Spatial organization of TAFs in relation to TSS and Rap1. (A) Averaged frequency distribution of shifted tags for TAFs and general factors in relation to RPG TSSs. Peak distances from the TSS are shown in parentheses. Each trace is separately and linearly scaled on the Y-axis. (B) Heat map representing Pearson correlation values for the occupancy of proteins at RPGs. (C) Bar graph comparing the occupancy of Sua7, TAFs, and Toa2 at RPGs relative to non-RPGs. (D) Frequency distribution of unshifted tag 5′ ends for TAFs, Toa2, and Sua7 compared with the equivalent for Rap1 (filled gray plot) and oriented with the TSS to the right. Tags on the antisense strand are inverted.
Figure 6.
Figure 6.
Occupancy levels at paralogous RPGs. Each row reports factor occupancy (percent rank for all but Hmo1) at paralogous RPG pairs (left vs. right set of columns). Maximum color intensity reflects a percent rank = 100.
Figure 7.
Figure 7.
Model of RPG promoter regulation. The three columns represent three variations of the core coregulation mechanism at RPGs based on no, narrow, and broad binding of Hmo1. The top and bottom rows depict models of Rap1-mediated repression and activation, respectively. The middle row depicts the transition state. Relevant TAF subunit numbers are shown. The PIC reflects the general transcription machinery and a transient presence of Pol II, which rapidly moves into the elongation phase. Whether assembly or actions of the PIC also affect +1 positioning is unclear.

Similar articles

Cited by

References

    1. Albert I, Wachi S, Jiang C, Pugh BF. 2008. GeneTrack—a genomic data processing and visualization framework. Bioinformatics 24: 1305–1306. - PMC - PubMed
    1. Badis G, Chan ET, van Bakel H, Pena-Castillo L, Tillo D, Tsui K, Carlson CD, Gossett AJ, Hasinoff MJ, Warren CL, et al. 2008. A library of yeast transcription factor motifs reveals a widespread function for Rsc3 in targeting nucleosome exclusion at promoters. Mol Cell 32: 878–887. - PMC - PubMed
    1. Berger AB, Decourty L, Badis G, Nehrbass U, Jacquier A, Gadal O. 2007. Hmo1 is required for TOR-dependent regulation of ribosomal protein gene transcription. Mol Cell Biol 27: 8015–8026. - PMC - PubMed
    1. Bosio MC, Negri R, Dieci G. 2011. Promoter architectures in the yeast ribosomal expression program. Transcription 2: 71–77. - PMC - PubMed
    1. Cherel I, Thuriaux P. 1995. The IFH1 gene product interacts with a fork head protein in Saccharomyces cerevisiae. Yeast 11: 261–270. - PubMed

Publication types

MeSH terms

Associated data

LinkOut - more resources