. 2015 Oct 13;112(41):12764-9.
doi: 10.1073/pnas.1423041112. Epub 2015 Sep 18.

Synthesis of phylogeny and taxonomy into a comprehensive tree of life

Affiliations

Synthesis of phylogeny and taxonomy into a comprehensive tree of life

Cody E Hinchliff et al. Proc Natl Acad Sci U S A. .

Abstract

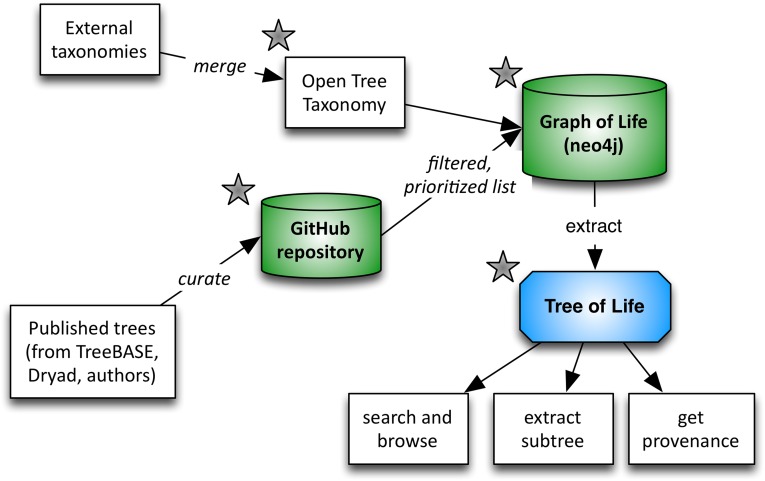
Reconstructing the phylogenetic relationships that unite all lineages (the tree of life) is a grand challenge. The paucity of homologous character data across disparately related lineages currently renders direct phylogenetic inference untenable. To reconstruct a comprehensive tree of life, we therefore synthesized published phylogenies, together with taxonomic classifications for taxa never incorporated into a phylogeny. We present a draft tree containing 2.3 million tips-the Open Tree of Life. Realization of this tree required the assembly of two additional community resources: (i) a comprehensive global reference taxonomy and (ii) a database of published phylogenetic trees mapped to this taxonomy. Our open source framework facilitates community comment and contribution, enabling the tree to be continuously updated when new phylogenetic and taxonomic data become digitally available. Although data coverage and phylogenetic conflict across the Open Tree of Life illuminate gaps in both the underlying data available for phylogenetic reconstruction and the publication of trees as digital objects, the tree provides a compelling starting point for community contribution. This comprehensive tree will fuel fundamental research on the nature of biological diversity, ultimately providing up-to-date phylogenies for downstream applications in comparative biology, ecology, conservation biology, climate change, agriculture, and genomics.

Keywords: biodiversity; phylogeny; synthesis; taxonomy; tree of life.


Conflict of interest statement

The authors declare no conflict of interest.

Figures

Fig. S1.
Fig. S1.
The Open Tree of Life workflow. External taxonomies (and synonym lists) are merged into the Open Tree Taxonomy, OTT. Published phylogenies are curated (rooted, and names mapped to OTT) and stored, with full edit history, in a GitHub repository. The source trees are decomposed into subproblems, and the loaded along with OTT into a common graph database. We traverse the resulting graph and extract a tree of life based on priority of inputs. Components with stars indicate the presence of application programming interfaces (APIs) to access data and services.
Fig. S2.
Fig. S2.
Size and scope of input trees. Plot of the number of tips in each of the 1,188 trees with some curation in the treestore. Scope is measured as the total number of tips recognized to be descended from the inferred most recent common ancestor of the source tree.
Fig. S3.
Fig. S3.
Inputs to subproblem decomposition with taxonomic mappings added. Uncontested taxa are shown in blue, and contested taxa are shown in red. The hollow circles at nodes in the phylogenetic trees represent internal nodes in the tree that do not map to any taxon. Note that an uncontested taxon will not map to the taxon that contests it. This example generates five subproblems, one for each uncontested node.
Fig. S4.
Fig. S4.
Decomposition into subproblems. The output of the decomposition into subproblems from the inputs shown in Fig. S3. Some nodes with outdegree = 1 have been suppressed because they are not needed in the rest of the pipeline. The node colorations in this figure are retained only to make it easier to compare the outputs to the inputs in Fig. S3; the status of a node as contested does not matter for the rest of the pipeline.
Fig. S5.
Fig. S5.
Creation of the tree alignment graph (TAG). We initialized the graph with nodes and edges for the taxonomy. Then, we created the graph nodes during the “merger nodes” and “accumulation nodes” steps and added scaffold edges that identify a subset of nested child relationships among the nodes. Finally, we mapped the input tree edges onto the corresponding edges in the scaffold, creating the TAG (colored edges in the final graph in lower right).
Fig. S6.
Fig. S6.
Generating the synthetic tree from the TAG. In synthesis, the nodes of the TAG are visited in topological order. At each node, a decision is made about which child edges would be included as child branches of the node, if the node were to occur in the final synthesis tree. Because nodes are visited in topological order, when we visit some node x, decisions have already been made for each child of x (and each of their children, and so forth), which means that each child node of x is the root of a synthesis subtree defined by those edges that have been selected at all of its descendant nodes. In other words, the procedure to select child edges to include at a given node can be thought of as a procedure to select the subtrees that would be the children of x in the final synthesis tree. The decision regarding which edges (i.e., subtrees) to include uses the DGR criterion—that is, the selected subtrees are those that contain the most TAG edges corresponding to edges in highly weighted input trees. To avoid defining a network rather than a tree, no two subtrees may be included that contain any tips in common. In this example, TAG edge colors identify source trees (corresponding to Fig. S5), and colored numbers identify the corresponding source tree edges. Each source tree edge corresponds to at least one edge in the TAG. At each node, a decision is made which edges would be included, which defines a set of unique input tree edges that would be represented in the synthesis subtree below the given node (shown in the list on the lower left). Any edges that are parallel to selected edges are also considered to be represented. The synthesis decision at the root (node 1) selects the edges leading to nodes 7 and 11 and rejects the edges leading to nodes 9 and 11 because edges 7 and 11 the representation of tree edges in the final synthesis tree. Note that input tree edges leading to tips (i.e., external edges) are considered represented if the tip itself occurs in the synthesis tree, regardless of whether the specific edge in question does or not.
Fig. 1.
Fig. 1.
Phylogenies representing the synthetic tree. The depicted tree is limited to lineages containing at least 500 descendants. (A) Colors represent proportion of lineages represented in NCBI databases. (B) Colors represent the amount of diversity measured by number of descendant tips. (C) Dark lineages have at least one representative in an input source tree.
Fig. 2.
Fig. 2.
The estimated total number of species, estimated number of named species in taxonomic databases, the number of OTUs with sequence data in GenBank, and the number of OTUs in the synthetic tree, for 10 major clades across the tree of life. Error bars (where present) represent the range of values across multiple sources. See Dataset S2 for the underlying data.
Fig. 3.
Fig. 3.
Conflict in the tree of life. Although the Open Tree of Life contains only one resolution at any given node, the underlying graph database contains conflict between trees and taxonomy (noting that these figures are conceptual, not a direct visualization of the graph). These two examples highlight ongoing conflict near the base of Eukaryota (A) and Metazoa (B). Images courtesy of PhyloPic (phylopic.org).
Fig. S7.
Fig. S7.
Conflict analysis. A supertree S with two internal nodes u and v, and three input trees T1, T2, and T3. The clade u is in conflict with T1, is supported by T2, and is irrelevant to T3. The clade v is irrelevant to T1 and T2, and is permitted by T3 because v is a resolution of the polytomy at the root in T3.

References

    1. Darwin C. The Origin of Species: By Means of Natural Selection, Or the Preservation of Favoured Races in the Struggle for Life. Cambridge Univ Press; Cambridge, UK: 1859.
    1. Mora C, Tittensor DP, Adl S, Simpson AGB, Worm B. How many species are there on Earth and in the ocean? PLoS Biol. 2011;9(8):e1001127. - PMC - PubMed
    1. Costello MJ, Wilson S, Houlding B. Predicting total global species richness using rates of species description and estimates of taxonomic effort. Syst Biol. 2012;61(5):871–883. - PubMed
    1. Dykhuizen D. Species numbers in bacteria. Proc Calif Acad Sci. 2005;56(6) Suppl 1:62–71. - PMC - PubMed
    1. Sanderson MJ. Phylogenetic signal in the eukaryotic tree of life. Science. 2008;321(5885):121–123. - PubMed

Publication types