. 2015 Dec:6:426-435.
doi: 10.1016/j.redox.2015.09.004. Epub 2015 Sep 10.

Combined activation of the energy and cellular-defense pathways may explain the potent anti-senescence activity of methylene blue

Affiliations

Combined activation of the energy and cellular-defense pathways may explain the potent anti-senescence activity of methylene blue

Hani Atamna et al. Redox Biol. 2015 Dec.

Abstract

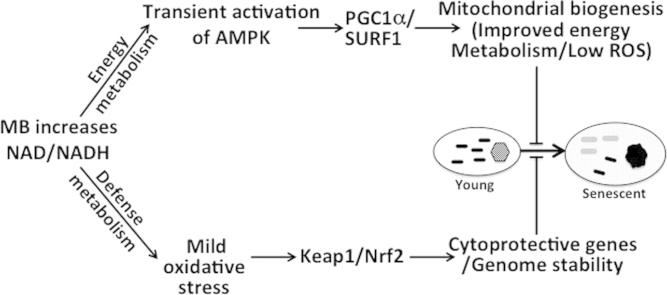
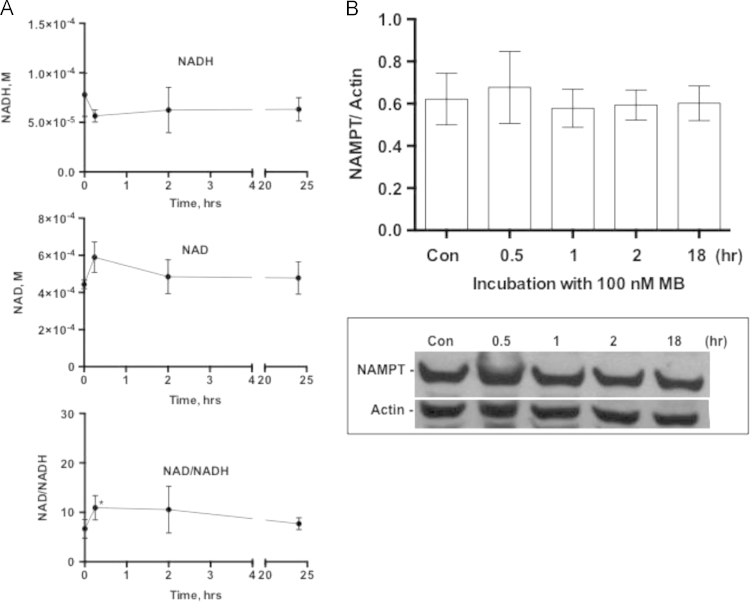
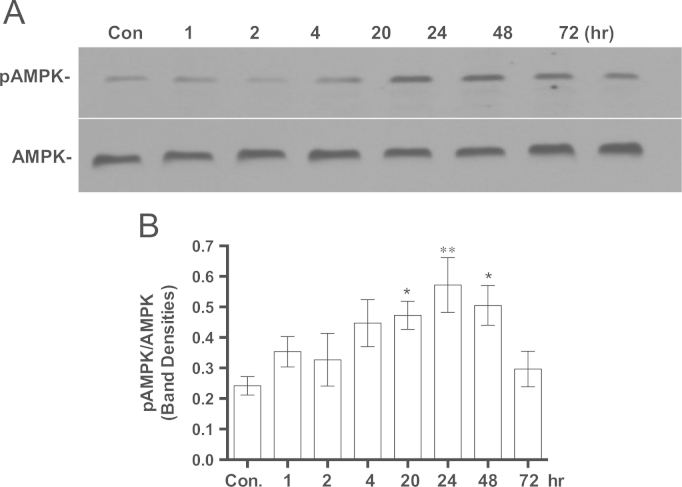
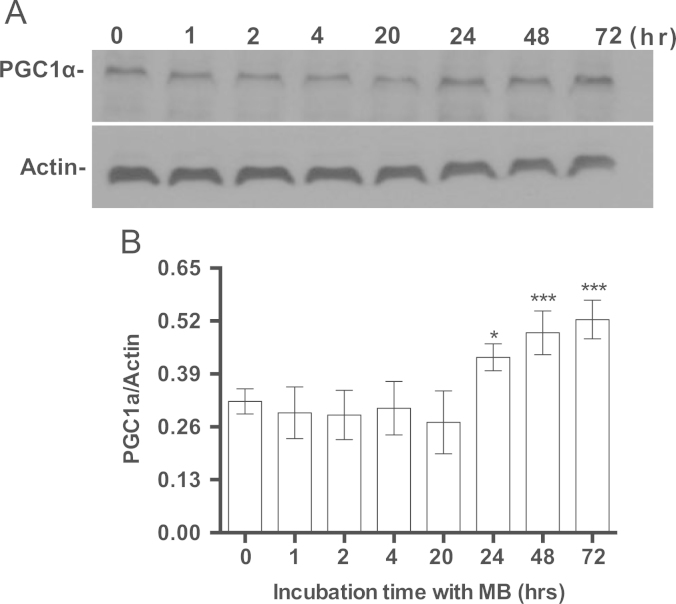
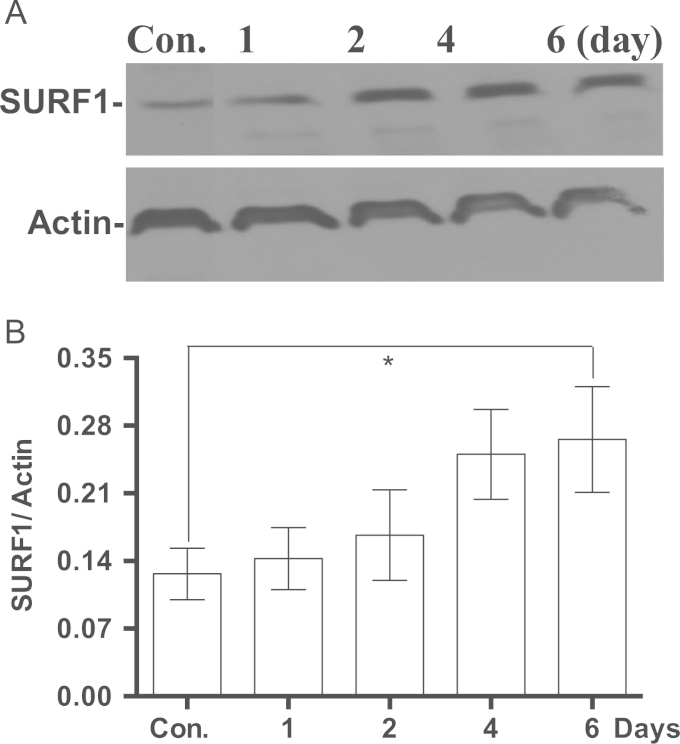
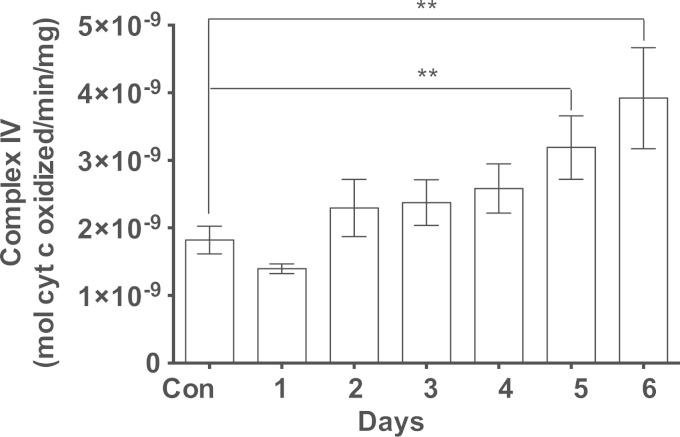
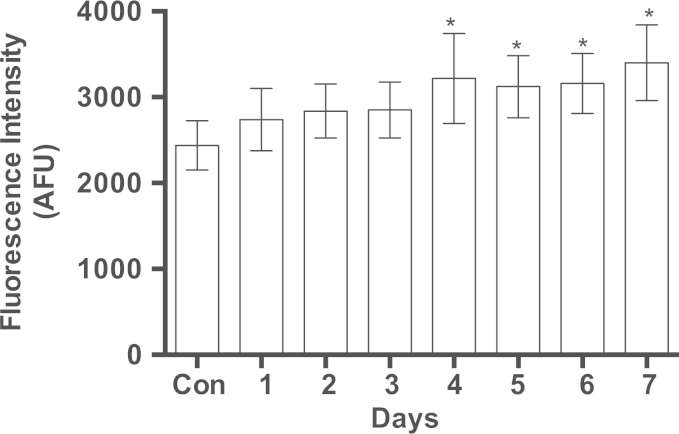
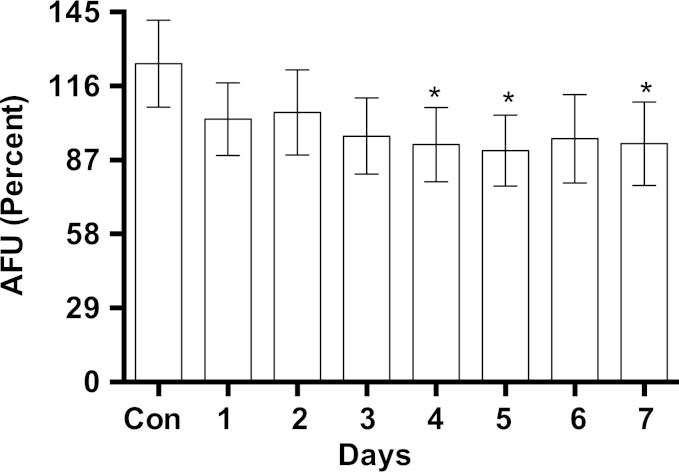
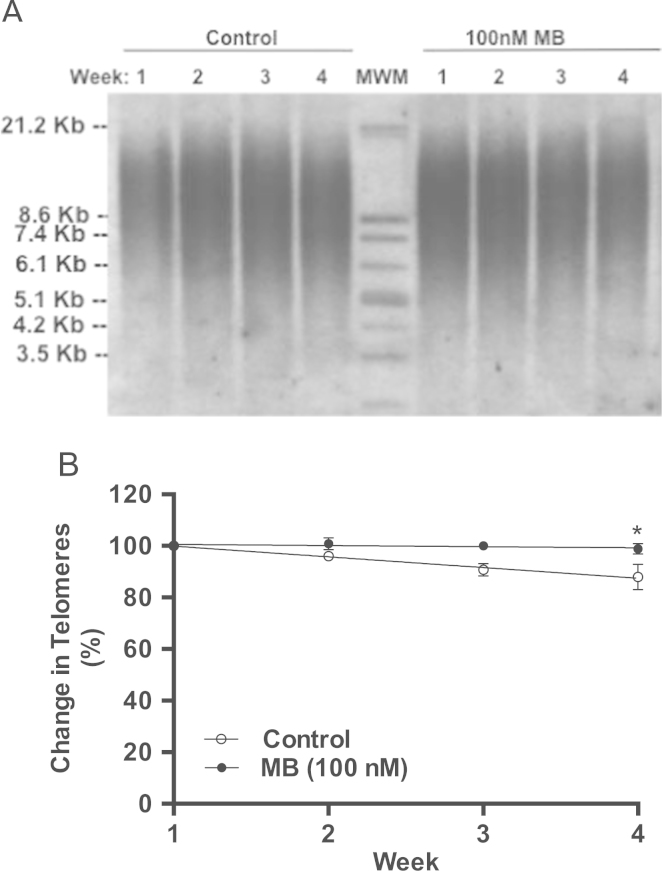
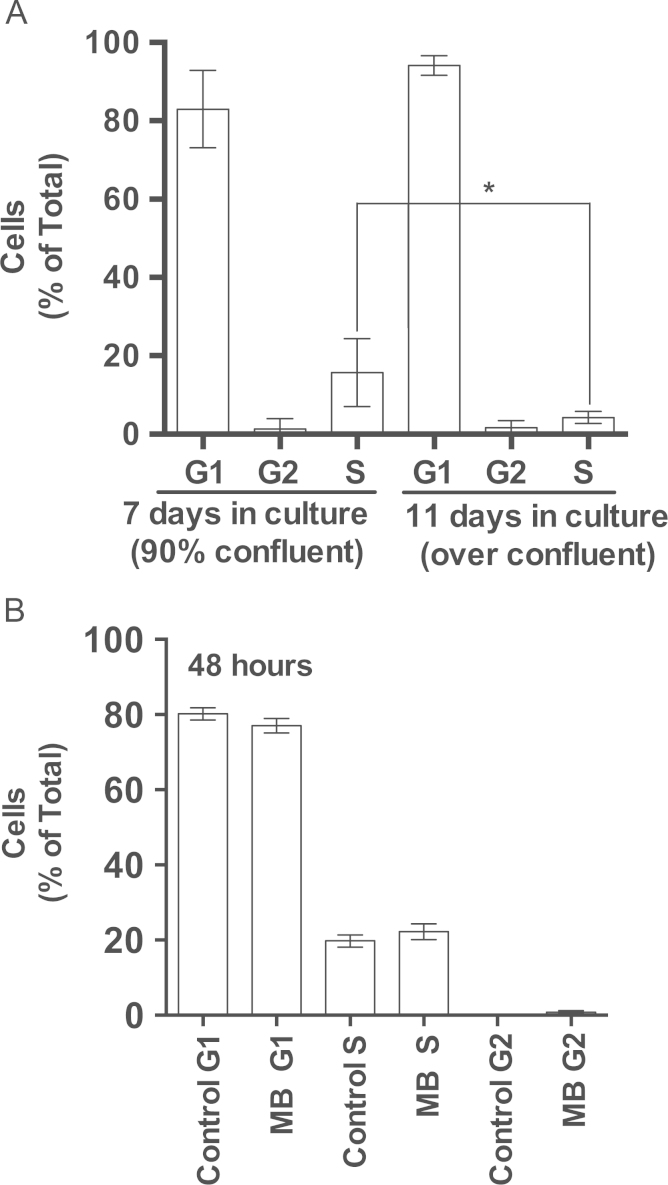
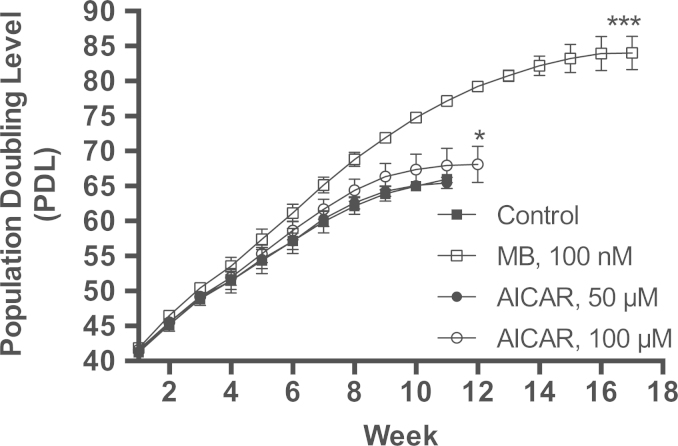
Methylene blue (MB) delays cellular senescence, induces complex-IV, and activates Keap1/Nrf2; however, the molecular link of these effects to MB is unclear. Since MB is redox-active, we investigated its effect on the NAD/NADH ratio in IMR90 cells. The transient increase in NAD/NADH observed in MB-treated cells triggered an investigation of the energy regulator AMPK. MB induced AMPK phosphorylation in a transient pattern, which was followed by the induction of PGC1α and SURF1: both are inducers of mitochondrial and complex-IV biogenesis. Subsequently MB-treated cells exhibited >100% increase in complex-IV activity and a 28% decline in cellular oxidants. The telomeres erosion rate was also significantly lower in MB-treated cells. A previous research suggested that the pattern of AMPK activation (i.e., chronic or transient) determines the AMPK effect on cell senescence. We identified that the anti-senescence activity of MB (transient activator) was 8-times higher than that of AICAR (chronic activator). Since MB lacked an effect on cell cycle, an MB-dependent change to cell cycle is unlikely to contribute to the anti-senescence activity. The current findings in conjunction with the activation of Keap1/Nrf2 suggest a synchronized activation of the energy and cellular defense pathways as a possible key factor in MB's potent anti-senescence activity.

Keywords: AMPK; Complex-IV; Mitochondria; NAD; Oxidants; Senescence; Telomeres.


Figures

fx1
Graphical abstract
Fig. 1
Fig. 1
The effect of MB on NAD/NADH ratio. IMR90 cells were cultured in the presence or absence of 100 nM MB for 0 (control), 0.25, 2, and 24 h. After harvesting the cultures the cells were counted and 105 cells were used to assay NADH and NAD with the help of EnzyChrom NAD/NADH Assay Kit as described in Section 2. The level of NAD and NADH was assayed by enzymatic recycling followed by measuring the change in absorbance at 565 nm at 0 and 15 min. A. The concentration of NADH (upper panel) and NAD (center panel) were calculated using a standard curve and those were used to calculate the ratio NAD/NADH (Lower Panel). Three independent experiments are shown each was performed in triplicates. Values are Mean±sem (t-test, *P<0.02). B. A representative immunoblot depicting the effect of MB on NAMPT as well as the ratio of NAMPT to Actin calculated from immuneblots similar to the one presented.
Fig. 2
Fig. 2
The effect of MB on pAMPK/AMPK ratio. IMR90 cells were seeded and incubated with 100 nM MB for different intervals. The cells were harvested at each specific time point and the cell lysates were prepared and stored at −80 °C. The proteins from each time point were analyzed with western blot using specific antibodies for pAMPK and AMPK as described in Section 2. The immuneblot image was captured on the x-ray film and the band density was quantified using ImageJ. A. Shows a representative immuneblot of pAMPK and AMPK. B. The ratio of pAMPK to AMPK was calculated from western blots similar to the one in A. Shown the Mean±sem of at least four independent experiments. One-way ANOVA, Dunnett's multiple comparisons test, *P<0.05, **P<0.001).
Fig. 3
Fig. 3
The effect of MB on the induction of PGC1α. IMR90 cells were seeded and incubated with 100 nM MB for different intervals. The cells were harvested at each specific time point and the cell lysates were prepared and stored at −80 °C. The proteins were analyzed with western blot using specific antibodies for PGC1α and Actin as described in Section 2. The immuneblot image was captured on the x-ray film and the band density was quantified using ImageJ. A. Shows a representative immunoblot of PGC1α and Actin. B. Shows the ratio of the densities of PGC1α to Actin. Shown is the Mean±sem of at least four independent experiments. One-way ANOVA, Bonferroni's multiple comparisons test (*P<0.05, ***P<0.001).
Fig. 4
Fig. 4
The effect of MB on SURF1. IMR90 cells were seeded and incubated with 100 nM MB for different intervals. The cells were harvested from each time point and the cell lysates were prepared and stored at −80 °C. The proteins were analyzed with western blot using specific antibodies for SURF1 and Actin as described in Section 2. The immuneblot image was captured on the x-ray film and the density of each band was quantified using ImageJ. A. Shows an immunoblot of SURF1 and Actin. B. The ratio of the densities of SURF1 to Actin. Shown is the Mean±sem of at least five independent experiments. Paired t-test, *p<0.04.
Fig. 5
Fig. 5
Time-dependent build-up of cytochrome c oxidase (Complex IV) activity in response to MB. IMR90 cell cultures were treated with 100 nM MB for increasing intervals (up to 6 days). At the end of each specific time point, the cells were harvested, the lysates were prepared, and complex IV activity was determined as described in Section 2. The assay buffer contained 10 mM Tris HCl/120 mM KCl, 0.3 µM n-Dodecyl beta-D-maltoside, pH 7. The rate of oxidation of the substrate ferrocytochrome c to ferricytochrome c was measured at 550 nm and used to calculate the enzymatic activity with the help of the millimolar extinction coefficient of 21.84. The data are Mean±sem of five independent experiments. **P<0.001, One-way ANOVA, Dunn's multiple comparisons test.
Fig. 6
Fig. 6
The effect of MB on the mitochondrial innermembrane. IMR90 cell cultures were treated with 100 nM MB for increasing intervals up to 7 days. The cultures were harvested by trypsinazation, counted, and resuspended into DMEM. One million cells of each time point were placed in designated tube and incubated in dark with 200 nM NAO. The fluorescence was measured using flow cytometry as described in Section 2. The data shown are the Mean AFU±SEM of four independent experiments, each performed in triplicate. *P<0.04, (One-way ANOVA, Dunnett's multiple comparisons test).
Fig. 7
Fig. 7
The effect of MB on intracellular oxidants. IMR90 cell cultures were treated with 100 nM MB for increasing intervals (up to 7 days). The cells were harvested by trypsinazation, counted, and resuspended into 25 mM HEPES (pH 7.3)/DMEM. One million cells of each specific time point were placed in the designated tube and incubated in dark with 1 µM of 2′,7′-dichlorfluorescein-diacetate (DCFH-DA) and the fluorescence of DCF was measured using flow cytometry as described in Section 2. The data shown are the percentages of the Mean AFU±sem of six independent experiments, each performed in triplicates. *P<0.01, (One-way ANOVA, Dunnett's multiple comparisons test).
Fig. 8
Fig. 8
The effect of MB on the length of telomeres in IMR90 cells. IMR90 cells were treated with 100 nM MB starting at PDL 27 and ending at PDL 44. The cells were split every week, PDL calculated, cultures were re-seeded (0.5 million/plate), and the remaining cells were collected for DNA extraction as described in Section 2. Genomic DNA was extracted and processed for telomere length analysis as instructed in TeloTAGGG Telomere Length Assay kit. A. Shows Southern blot of terminal restriction fragments (TRF) after digesting the genomic DNA. B. The rate of telomeres erosion. The rate was calculated from the Kb distribution of TRF from three Southern blots similar to the one shown in A. The rate of telomere erosion was about 0.49 kb/week and 0.03 kb/week in control and MB-treated cells respectively (*P<0.02, t-test).
Fig. 9
Fig. 9
The effect of MB on the cell cycle of IMR90 cells. IMR90, normal human cells, were synchronized by contact inhibition and used to seed new cultures. One group of the new cultures was assigned to 100 nM MB while the other group remained as control. Both groups were incubated for 18, 24, 48, and 72 h. At the end of each time point the cells were harvested, washed with ice-cold PBS, and prepared for flow cytometry analysis for the various stages of the cell cycle as described in Material and Methods. The data from the flow cytometer was used for determining the distribution of the various stages of cell cycle with the help of ModFit software (Verity Software, Topsham, ME). A. Shows the synchronization of the cells and the distribution of the cell cycle stages in 90% confluent culture and in over confluent culture. Each time point represents the Mean±sem of three independent experiments, each performed in triplicates. *P<0.05 One-way ANOVA, Friedman test. B. Shows the distribution of the cell cycle stages in MB-treated and control cultures at the time point 48 h. Although several intervals were tested, shown are the data from 48 h incubation with MB (see text for details).
Fig. 10
Fig. 10
Comparing the anti-senescence activity of AICAR to MB. IMR90 cells were maintained with MB, AICAR, or control until they senesce. The senescence of IMR90 cells was measured by continuously maintaining the cells in culture as described in Materials and Methods. The control cells gained 66 PDLs and senesced at week 11 (closed squares), 100 nM MB-treated cells gained 84 PDLs and senesced at week 17 (open squares), the 50 µM AICAR-treated cells gained 65.4 PDLs and senesced at week 11 (closed circles), and 100 µM AICAR-treated cells gained 68.1 PDLs and senesced at week 12 (open circles). Each time point represents the average of the PDLs that were calculated from three independent experiments. The data shown is the Mean±sem. One-way ANOVA, Dunnett's multiple comparisons test. *P<0.05, ***P<0.001.
Scheme 1
Scheme 1
MB interacts with AMPK and Keap1/Nrf2 pathways that oversee energy and cellular defense metabolism, respectively. MB increases the ratio of NAD/NADH, which connects to the cellular energy regulation (pAMPK) and the cytoprotective mechanisms (Keap1/Nrf2). The increase in NAD/NADH, which is fast and transient, is followed by an increase in pAMPK/AMPK. AMPK plays key role in energy metabolism through mitochondrial and complex IV biogenesis (and activity). The biogenesis of complex IV requires SURF1 while PGC1α is important for mitochondrial biogenesis, maintenance, and function. MB also activates the Keap1/Nrf2 pathway, which plays central role in the defense metabolism against oxidants and xenobiotic that may damage DNA, lipids, and proteins. The induction of the cytoprotective mechanism in conjunction with lower levels of oxidants as well as the induction of complex IV and improvement of mitochondrial respiration are likely to enhance genome stability and slow telomeres erosion. Black and gray bars represent mitochondria from young and old cells, respectively. The hexagon represents nucleus from a young cell while dark circle represents the morphological and heterochromatin changes in old cell.

Similar articles

Cited by

References

    1. Rodier F., Campisi J. Four faces of cellular senescence. J. Cell Biol. 2011;192:547–556. - PMC - PubMed
    1. Baker D.J., Weaver R.L., van Deursen J.M. p21 both attenuates and drives senescence and aging in BubR1 progeroid mice. Cell Rep. 2013;3:1164–1174. - PMC - PubMed
    1. Tyner S.D., Venkatachalam S., Choi J., Jones S., Ghebranious N., Igelmann H., Lu X., Soron G., Cooper B., Brayton C., Park S.H., Thompson T., Karsenty G., Bradley A., Donehower L.A. p53 mutant mice that display early ageing-associated phenotypes. Nature. 2002;415:45–53. - PubMed
    1. Hinkal G.W., Gatza C.E., Parikh N., Donehower L.A. Altered senescence, apoptosis, and DNA damage response in a mutant p53 model of accelerated aging. Mech. Ageing Dev. 2009;130:262–271. - PMC - PubMed
    1. Geng Y.Q., Guan J.T., Xu X.H., Fu Y.C. Senescence-associated beta-galactosidase activity expression in aging hippocampal neurons. Biochem. Biophys. Res. Commun. 2010;396:866–869. - PubMed

Publication types

MeSH terms

LinkOut - more resources