. 2015 Sep 21:5:14167.
doi: 10.1038/srep14167.

Hyperspectral Microscopy of Near-Infrared Fluorescence Enables 17-Chirality Carbon Nanotube Imaging

Affiliations

Hyperspectral Microscopy of Near-Infrared Fluorescence Enables 17-Chirality Carbon Nanotube Imaging

Daniel Roxbury et al. Sci Rep. .

Abstract

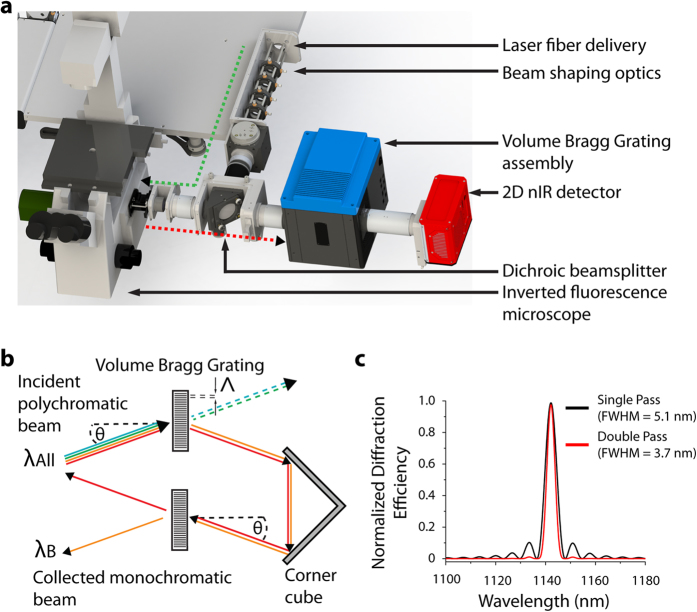
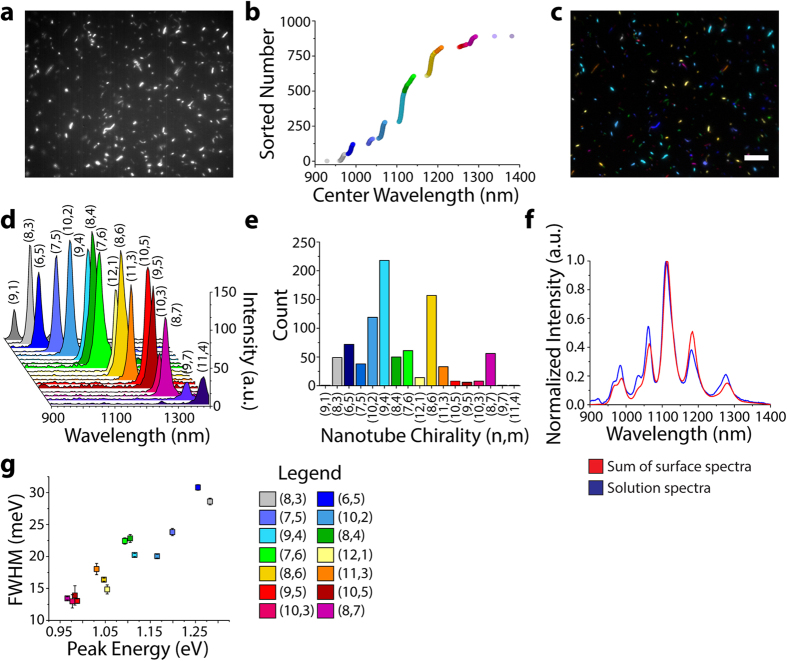
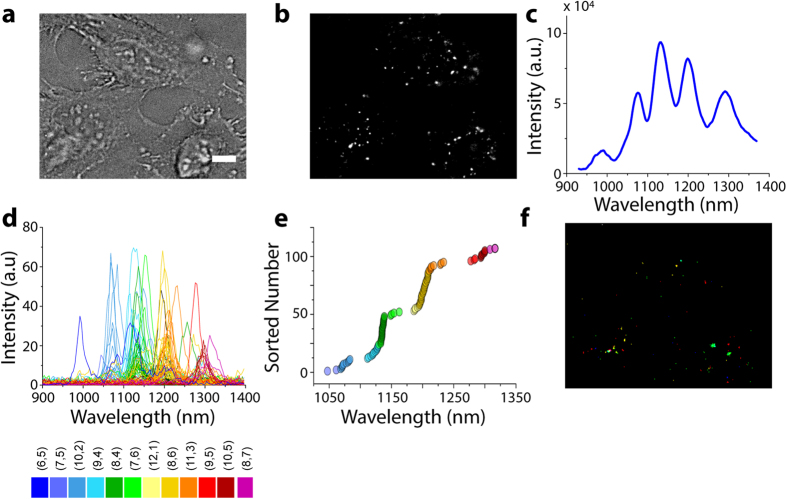
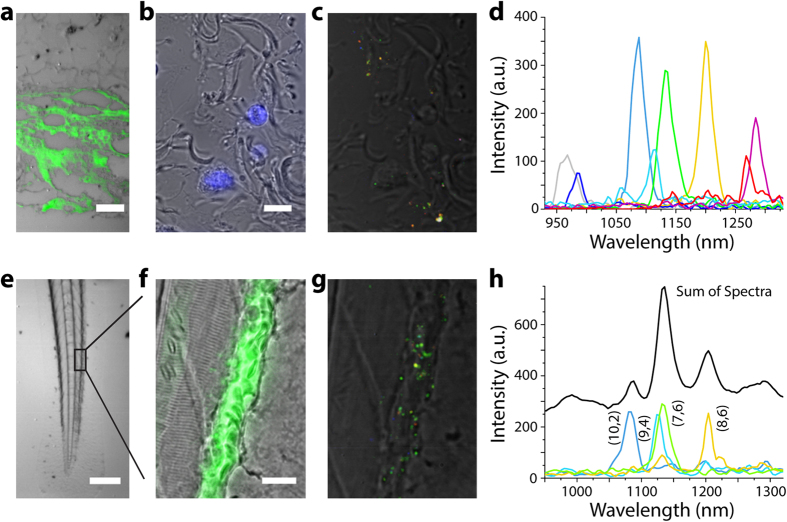
The intrinsic near-infrared photoluminescence (fluorescence) of single-walled carbon nanotubes exhibits unique photostability, narrow bandwidth, penetration through biological media, environmental sensitivity, and both chromatic variety and range. Biomedical applications exploiting this large family of fluorophores will require the spectral and spatial resolution of individual (n,m) nanotube species' fluorescence and its modulation within live cells and tissues, which is not possible with current microscopy methods. We present a wide-field hyperspectral approach to spatially delineate and spectroscopically measure single nanotube fluorescence in living systems. This approach resolved up to 17 distinct (n,m) species (chiralities) with single nanotube spatial resolution in live mammalian cells, murine tissues ex vivo, and zebrafish endothelium in vivo. We anticipate that this approach will facilitate multiplexed nanotube imaging in biomedical applications while enabling deep-tissue optical penetration, and single-molecule resolution in vivo.


Conflict of interest statement

S.B.-O. is founder of, and S.M. and M.V. are employees of Photon Etc., a company that manufactures hyperspectral imaging technology.

Figures

Figure 1
Figure 1. Near-infrared fluorescence hyperspectral microscope.
(a) A reconstruction of the hyperspectral imaging microscope indicating the injection of the excitation laser (green) into the inverted microscope assembly and the nIR emission from the sample (red), collected by the 2D nIR InGaAs detector via the volume Bragg grating (VBG). (b) Schematic of the VBG: a specific wavelength component of the incident polychromatic light λAll is diffracted by the grating as a function of incident angle θ, refractive index n, and grating period Λ, while the remaining wavelengths are transmitted through the grating. After a second passage through the VBG, a monochromatic beam λB exits. (c) Normalized diffraction efficiency after one (red) and two (black) passes through the VBG for λB equal to 1142 nm.
Figure 2
Figure 2. Hyperspectral microscopy of carbon nanotubes on a surface.
(a) A nIR broadband (900–1500 nm) fluorescence image of SDC-suspended HiPco carbon nanotubes adsorbed to a glass surface. (b) The center wavelengths from fitted emission spectra obtained from hyperspectral cubes, sorted in ascending order. (c) A false-color image of the same region as shown above, colored by nanotube chirality. Scale bar, 10 μm. (d) A representative spectrum of a single nanotube of each of the 17 species detected in a 500 nm emission window. (e) The total population of each nanotube species summed from hyperspectral cubes of 10 different 90 μm by 70 μm regions. (f) The population distribution derived from the spectral sum of the 17 Gaussian distributions (red) closely approximated the bulk solution spectrum obtained with the same excitation wavelength (blue). (g) Photoluminescence spectral bandwidth of nanotube chiralities, plotted by emission energy; error bars denote standard error of the mean.
Figure 3
Figure 3. Hyperspectral microscopy of individual carbon nanotubes in live mammalian cells.
(a) Transmitted light image of live HeLa cells incubated with SDC-dispersed nanotubes for 30 minutes. Scale bar, 10 μm. (b) Broadband nIR image (900–1600 nm) of the same region. (c) Near-infrared spectrum of carbon nanotubes from within HeLa cells as acquired from a conventional spectrometer/nIR detector. (d) Spectra from within the live HeLa cells, acquired from 10 cubes of hyperspectral data. (e) Fitted emission peak wavelength values sorted in ascending order by emission wavelength. (f) False-colored image of the same region as shown in (b), colored by nanotube chirality.
Figure 4
Figure 4. Hyperspectral microscopy of carbon nanotubes ex vivo and in vivo.
(a) A vertical cross section of formalin-fixed and paraffin-embedded dermal tissue harvested from a mouse after subcutaneous injection of carbon nanotubes. Scale bar, 50 μm. (b) Horizontal cross section of tissue stained with DAPI (blue). Scale bar, 10 μm. (c) Spectrally-resolved nIR emission merged with a transmitted light image in horizontal cross section. (d) Spectra of 8 individual species of nanotubes present in the imaging field. (e) Transmitted light image of an anesthetized zebrafish injected with nanotubes via the common cardinal vein. Scale bar, 200 μm. (f) Magnified transmitted light image of zebrafish tail fin and FITC-500 kDa-dextran fluorescence (green), delineating blood vessels. Scale bar, 20 μm. (g) Spectrally-resolved nIR emission overlaid with a transmitted light image of the same region. (h) Representative spectra of 4 individual nanotube species found in the zebrafish caudal vein. The majority of bright regions contained multiple co-localized nanotubes (black curve). Since the (7,6) nanotube species was the dominant peak in these aggregates, a high prevalence of green is found in the color-coded nIR emission image.

References

    1. Cheong W.-F., Prahl S. A. & Welch A. J. A review of the optical properties of biological tissues. IEEE journal of quantum electronics 26, 2166–2185 (1990).
    1. Lichtman J. W. & Conchello J.-A. Fluorescence microscopy. Nat Meth 2, 910–919 (2005). - PubMed
    1. Cherukuri P., Bachilo S. M., Litovsky S. H. & Weisman R. B. Near-Infrared Fluorescence Microscopy of Single-Walled Carbon Nanotubes in Phagocytic Cells. J. Am. Chem. Soc. 126, 15638–15639 (2004). - PubMed
    1. O’Connell M. J. et al. Band gap fluorescence from individual single-walled carbon nanotubes. Science 297, 593–596 (2002). - PubMed
    1. Welsher K., Sherlock S. P. & Dai H. Deep-tissue anatomical imaging of mice using carbon nanotube fluorophores in the second near-infrared window. Proc. Natl. Acad. Sci. USA 108, 8943–8948 (2011). - PMC - PubMed

Publication types

MeSH terms